Biturai Trading Wiki
The ultimate crypto encyclopedia. Verified by experts.

Pennant Pattern Explained: A Comprehensive Guide for Crypto Traders
The Pennant pattern is a continuation pattern in technical analysis, signaling a brief pause in a price trend before the trend continues. Understanding this pattern can significantly improve your trading strategies in the volatile crypto markets.

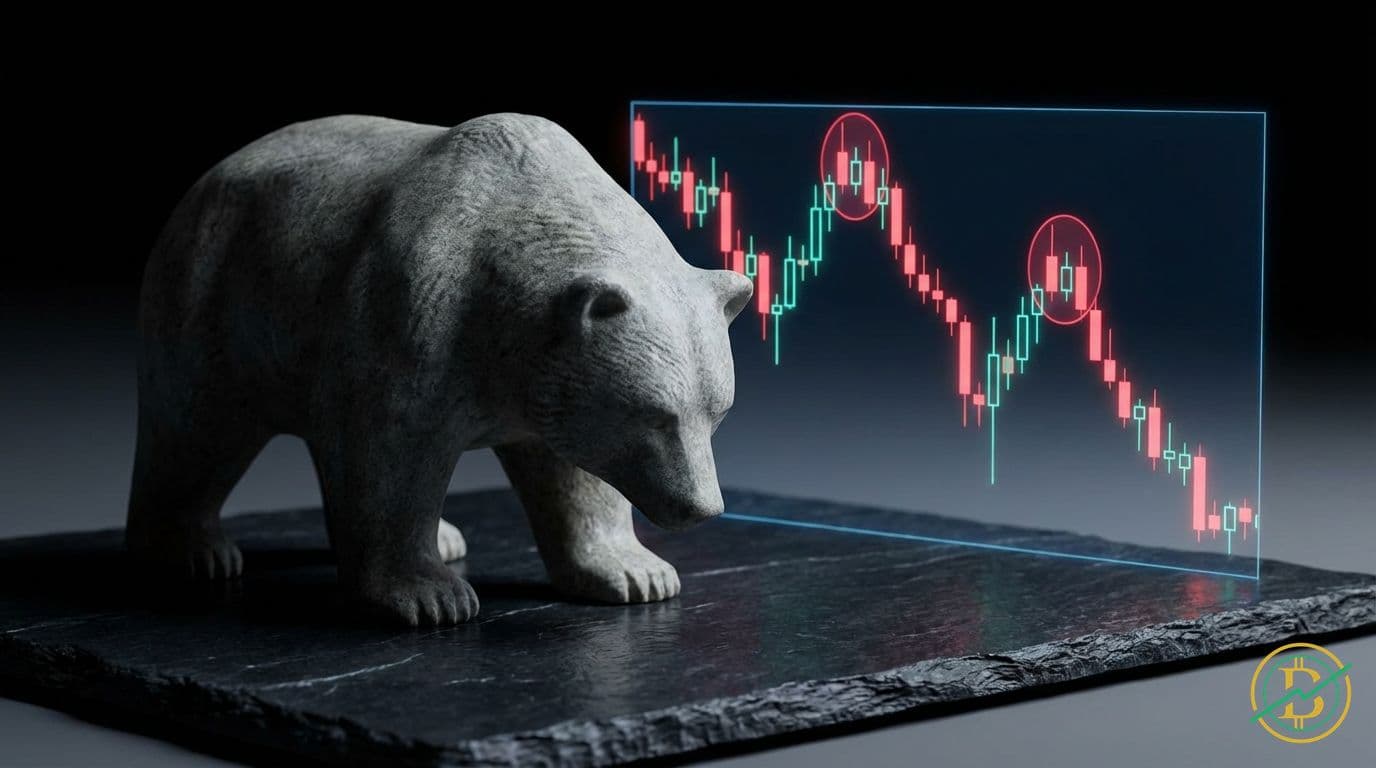
Bear Flag: A Comprehensive Guide for Crypto Traders
The bear flag is a bearish continuation pattern, signaling a likely continuation of a downtrend. Understanding this pattern allows traders to anticipate potential price declines and manage risk effectively.

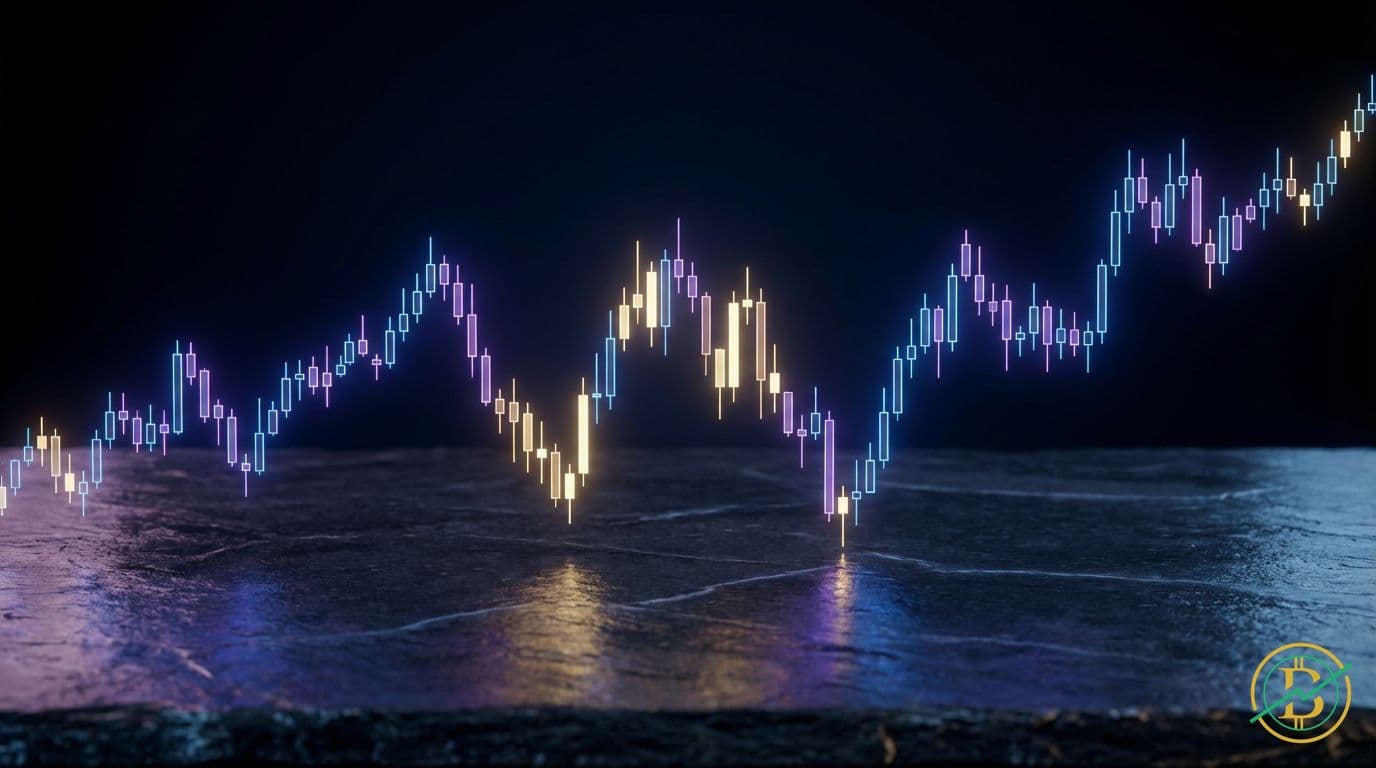
Flag Pattern in Crypto Trading: A Comprehensive Guide
The flag pattern is a popular chart formation used in technical analysis to identify potential continuation of an existing trend. This guide will teach you everything you need to know about identifying and trading flag patterns in the crypto market.
Island Reversal Pattern in Crypto Trading
The Island Reversal is a powerful chart pattern signaling a potential major shift in market direction. It's identified by a price gap, followed by a consolidation phase forming an 'island', and then another gap in the opposite direction.

Kicker Pattern: A Comprehensive Guide
The Kicker Pattern is a powerful two-candlestick formation signaling a sharp reversal in price direction. It indicates strong buying or selling pressure, often leading to significant price movements. Understanding this pattern can significantly improve your trading strategies.

Three Black Crows Candlestick Pattern: A Biturai Guide
The Three Black Crows is a bearish candlestick pattern indicating a potential trend reversal from bullish to bearish. It is formed by three consecutive long bearish candlesticks.
Tweezer Top Candlestick Pattern: A Comprehensive Guide
The Tweezer Top is a bearish reversal candlestick pattern that signals a potential shift from bullish to bearish momentum. Identifying this pattern can help traders anticipate price declines and make informed trading decisions.

Piercing Pattern Explained: A Comprehensive Guide
The Piercing Pattern is a bullish reversal candlestick formation signaling a potential shift from a downtrend to an uptrend. Understanding this pattern, its mechanics, and associated risks is crucial for making informed trading decisions.

Engulfing Pattern Explained: A Comprehensive Guide
The **Engulfing Pattern** is a powerful candlestick formation signaling potential market reversals. This pattern, easily recognizable, suggests a shift in momentum, offering traders valuable insights into price action and potential trading opportunities.

Gravestone Doji: A Comprehensive Guide to Bearish Reversal
The Gravestone Doji is a bearish candlestick pattern that signals a potential reversal of an uptrend. It forms when the opening, closing, and low prices of an asset are nearly the same, resembling an inverted 'T'.

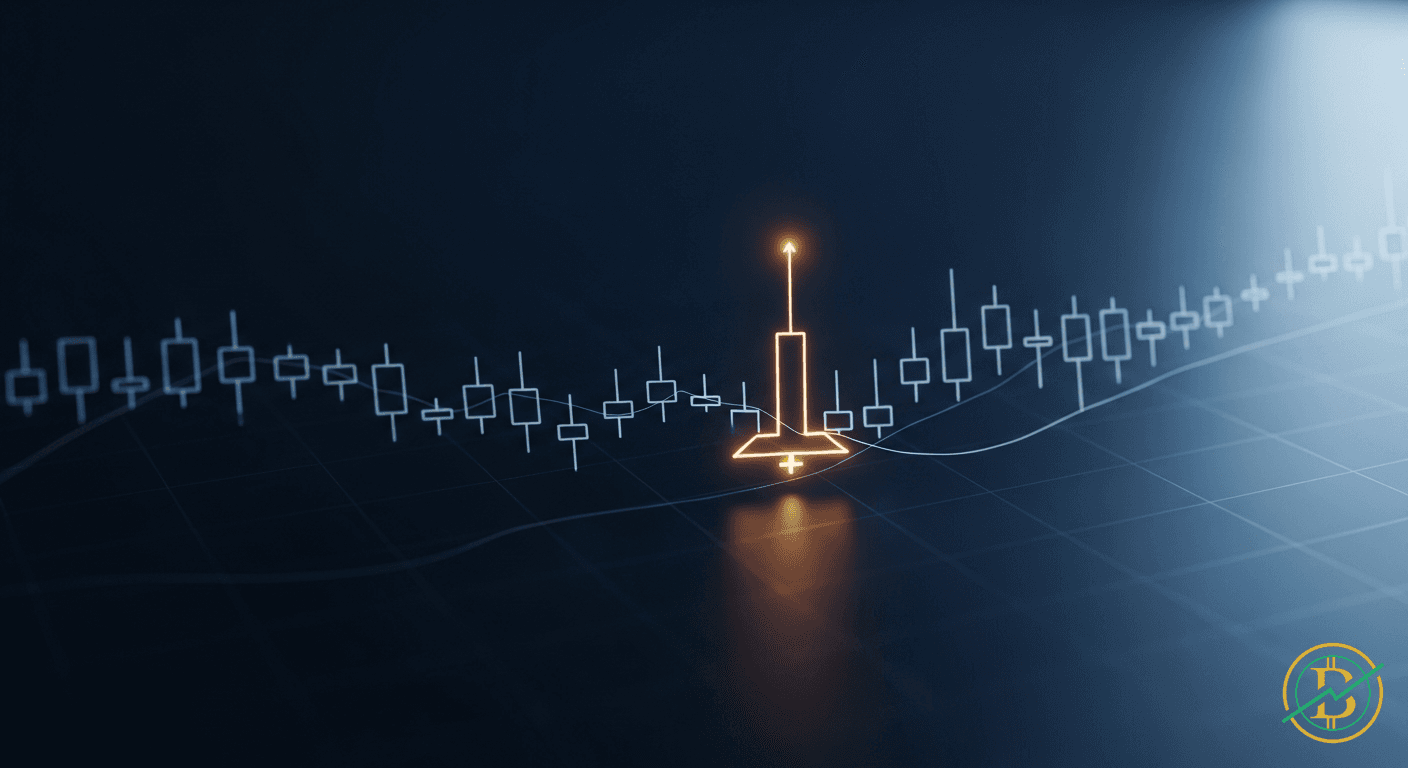
Dragonfly Doji: A Comprehensive Guide to Bullish Reversals
The Dragonfly Doji is a powerful candlestick pattern signaling a potential bullish reversal. It appears when sellers initially drive prices down, but buyers then step in to push the price back up to, or very close to, the opening price.
Inverted Hammer Candlestick Pattern: A Biturai Guide
The Inverted Hammer is a bullish reversal candlestick pattern, appearing at the end of a downtrend and suggesting a potential price increase. It’s a single-candle formation with a small body and a long upper wick, signaling that buyers may be starting to take control.

Inverse Head and Shoulders: A Biturai Guide to Bullish Reversals
The Inverse Head and Shoulders pattern is a powerful technical analysis formation that signals a potential bullish reversal after a downtrend. Understanding this pattern is crucial for identifying profitable trading opportunities in the crypto market.

Double Top: A Comprehensive Guide to Bearish Reversal Patterns
A Double Top is a bearish technical analysis pattern that signals a potential reversal from an uptrend to a downtrend. It forms when an asset's price reaches a high point twice, with a moderate decline in between, suggesting a possible shift in market sentiment.

Hammer Candlestick Pattern: A Guide for Crypto Traders
The Hammer candlestick pattern is a bullish reversal signal that appears at the bottom of a downtrend. It signals that buyers are starting to take control, potentially leading to a price increase. Understanding the Hammer can significantly improve your ability to identify potential entry points and manage risk in crypto trading.

Evening Star: A Comprehensive Guide to Bearish Reversal
The Evening Star is a bearish candlestick pattern that indicates a potential trend reversal from bullish to bearish. This guide will provide a deep dive into understanding and trading this powerful pattern.

Diamond Bottom: A Comprehensive Guide
The Diamond Bottom is a bullish reversal chart pattern, typically signaling the end of a downtrend. It's formed by two symmetrical triangles and indicates that buyers are starting to gain control.

Diamond Top Chart Pattern: A Comprehensive Guide
The Diamond Top is a bearish reversal pattern, signaling a potential trend change from bullish to bearish. This guide provides a detailed understanding of the Diamond Top, its mechanics, and how to use it in crypto trading.
Bump and Run Reversal: Decoding the Market's U-Turn
The Bump and Run Reversal (BARR) pattern signals a potential end to an uptrend, providing traders with an opportunity to anticipate a price decline. This pattern, characterized by a rapid 'bump' followed by a sustained 'run', offers valuable insights into market sentiment and potential profit-taking strategies.

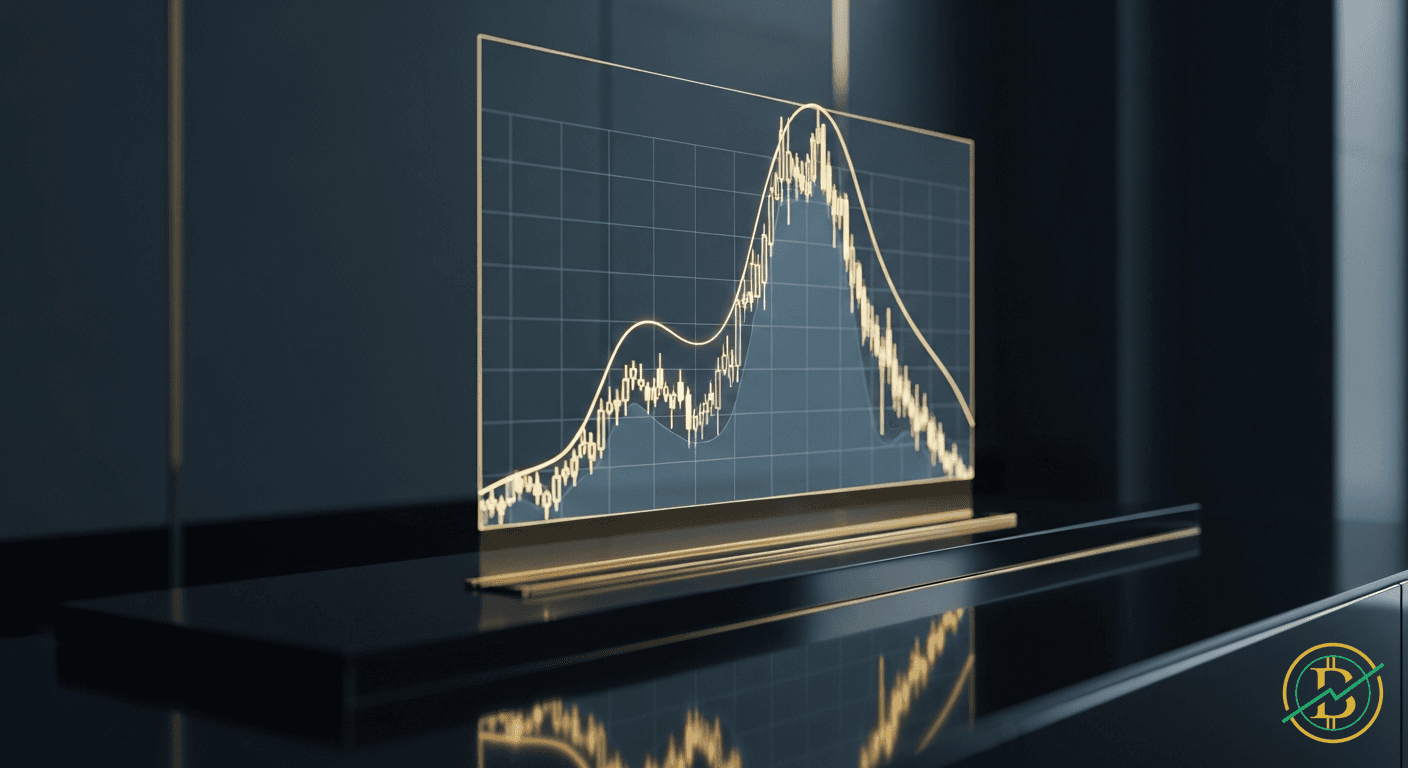
Rounding Bottom: A Comprehensive Guide to Bullish Reversals in Crypto
The Rounding Bottom is a bullish chart pattern indicating a potential trend reversal from bearish to bullish. It resembles a 'U' shape and signals a gradual shift in market sentiment, offering traders opportunities to capitalize on the emerging uptrend.