Biturai Trading Wiki
The ultimate crypto encyclopedia. Verified by experts.

Triple Top Chart Pattern: A Comprehensive Guide
The Triple Top is a bearish chart pattern signaling a potential reversal of an uptrend. It forms when an asset price attempts to break a resistance level three times and fails, leading to a decline.

Triple Bottom: A Comprehensive Guide
A Triple Bottom is a bullish reversal pattern, signaling a potential shift from a downtrend to an uptrend. This pattern forms when an asset's price tests a support level three times without breaking below it, creating three distinct lows.

Rounding Top Chart Pattern: A Comprehensive Guide
The Rounding Top is a bearish reversal pattern that signals a potential end to an uptrend. It's a key tool for crypto traders to identify opportunities to short or exit long positions.

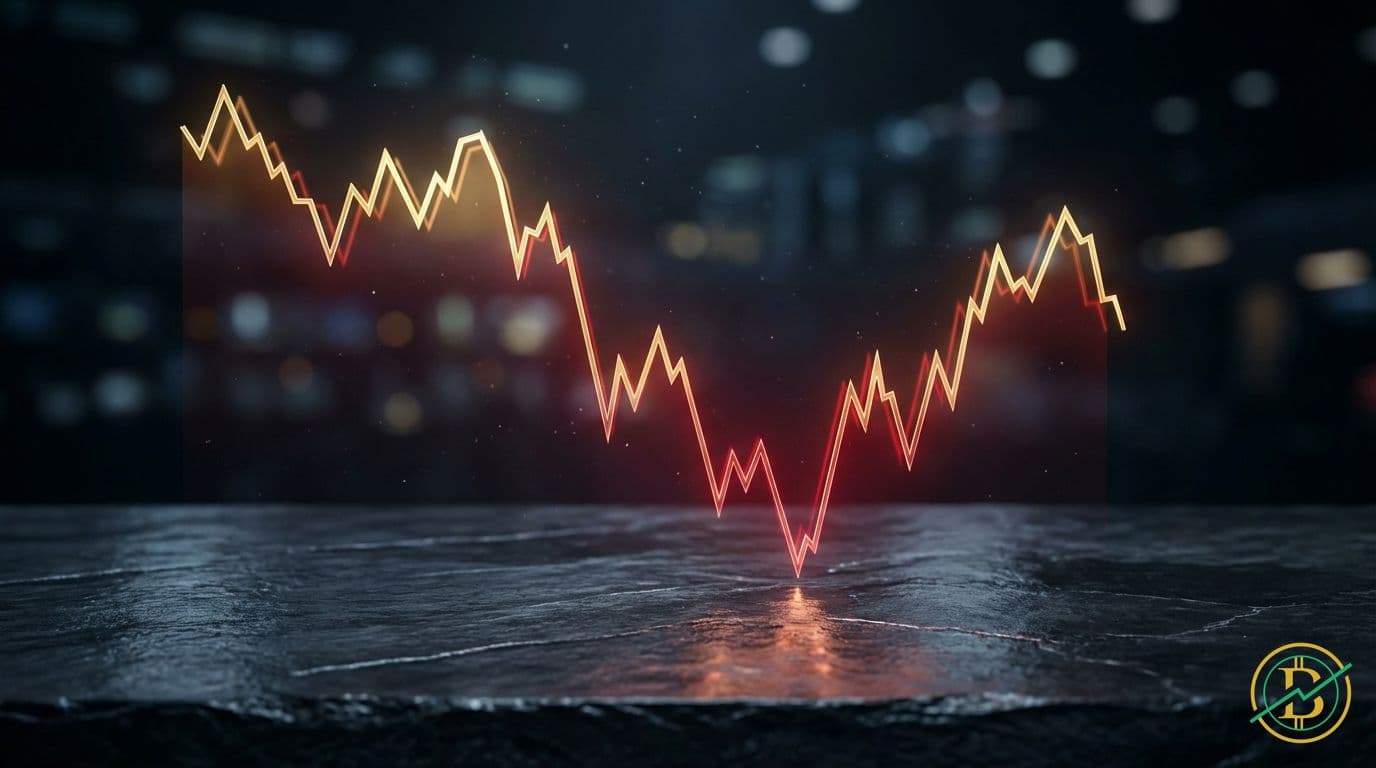
Double Bottom Pattern Explained
The Double Bottom pattern is a bullish technical analysis formation indicating a potential reversal from a downtrend. It signals that the price has found strong support at a specific level, making it a key indicator for traders.

Dynamic Support and Resistance in Cryptocurrency
Dynamic support and resistance levels are constantly adjusting price boundaries. These levels shift with market movement to create flexible trading zones, reflecting current price action.

Woodie Pivot Points: A Comprehensive Guide for Crypto Traders
Woodie Pivot Points are a technical analysis tool used to identify potential support and resistance levels in the market. They are calculated using the previous day's open, high, low, and close prices, providing traders with valuable insights to make informed trading decisions.

Murrey Math Lines: The Ultimate Crypto Trading Guide
Murrey Math Lines are a technical analysis tool that helps traders identify potential support and resistance levels. By dividing price ranges into eighths, it provides a framework for anticipating price movements.

Gann Square: Decoding Time and Price in Crypto
The Gann Square is a technical analysis tool that uses geometric principles to forecast price movements by analyzing time and price relationships. It helps traders identify potential support and resistance levels and predict future price targets.

Gann Fan: Decoding Price Action with Geometric Precision
The Gann Fan is a technical analysis tool that uses angles to predict future price movements. It helps traders identify potential support and resistance levels. Understanding the Gann Fan can significantly improve your ability to time trades and manage risk.

Fibonacci Time Zones: Decoding Market Timing
Fibonacci Time Zones are a technical analysis tool used to identify potential market turning points based on the Fibonacci sequence. They help traders anticipate when price reversals might occur. This article will explain how to use them effectively.

Fibonacci Arcs: A Biturai Trading Encyclopedia Deep Dive
Fibonacci Arcs are a technical analysis tool used by traders to identify potential support and resistance levels. They are based on the Fibonacci sequence and can help traders anticipate market reactions and plan trades strategically.

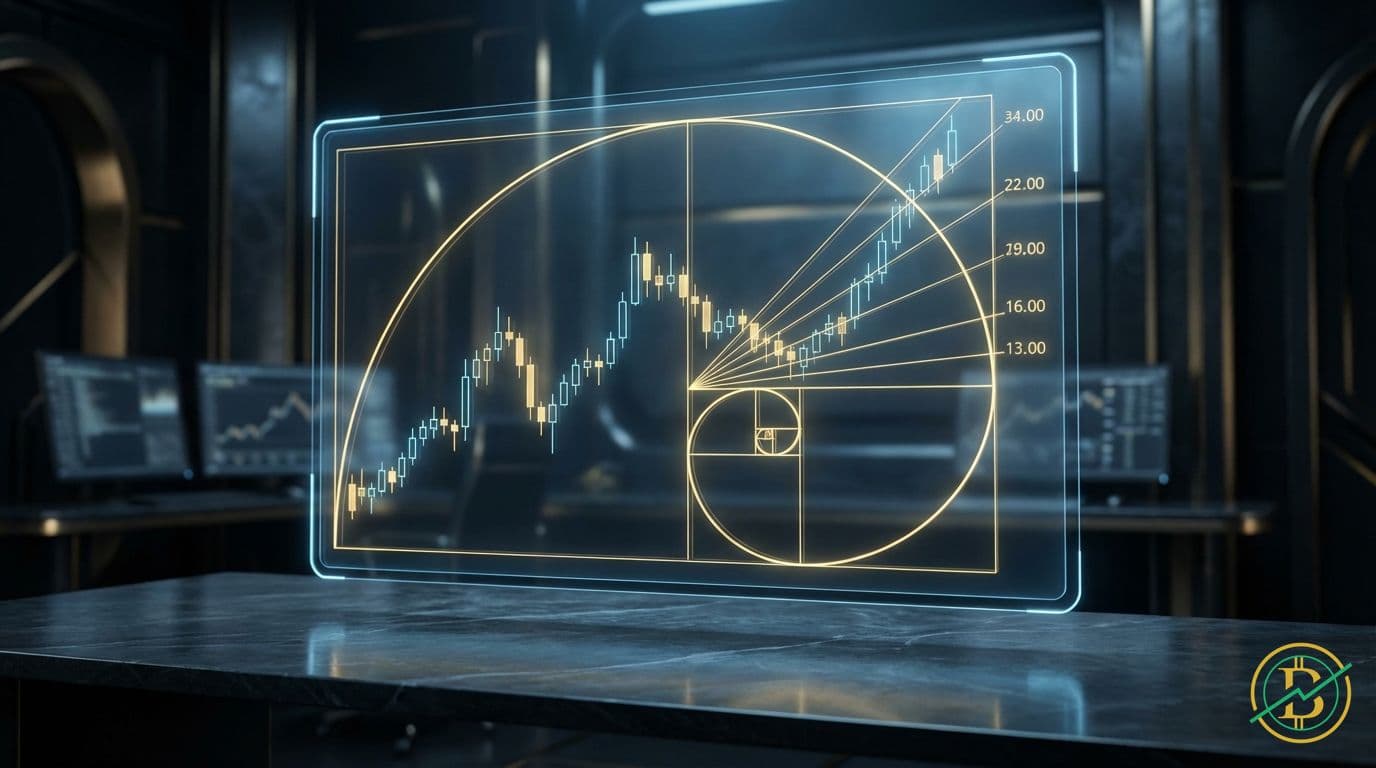
Fibonacci Fan: A Comprehensive Guide for Crypto Traders
The Fibonacci Fan is a technical analysis tool that helps traders identify potential support and resistance levels on a price chart. It uses Fibonacci ratios to project future price movements, aiding in informed trading decisions.
Fibonacci Extension: Projecting Price Targets in Crypto Trading
Fibonacci Extensions are a powerful technical analysis tool used by traders to forecast potential price targets after a trend has retraced. They utilize Fibonacci ratios to identify key levels where price may find support or resistance, helping traders plan entries and exits.

Money Flow in Crypto: A Comprehensive Guide
Money flow in crypto refers to the movement of capital into and out of the crypto market. Understanding money flow is crucial for traders as it directly impacts asset prices and market trends.

Ease of Movement Indicator: Decoding Price and Volume Dynamics
The Ease of Movement (EOM) indicator is a technical analysis tool that helps traders understand the relationship between price changes and trading volume. It essentially measures how easily a price moves up or down based on the volume supporting that movement.

Volume Profile: Your Guide to Market Depth
Volume Profile is a powerful technical analysis tool that reveals trading activity at specific price levels. By understanding where volume concentrates, traders can identify potential support and resistance zones, and make more informed decisions.

Chaikin Money Flow (CMF): A Comprehensive Guide
The Chaikin Money Flow (CMF) is a technical analysis indicator that measures the buying and selling pressure of an asset over a specific period. It helps traders identify potential trend reversals and assess the strength of a price movement by combining price and volume data.

Volatility Index (VIX) Explained for Crypto Traders
The Volatility Index (VIX), often called the "fear index", measures market expectations of future volatility. While a direct VIX equivalent doesn't exist for crypto, understanding its principles and applying them to crypto markets is crucial for risk management and informed trading.
Ulcer Index Explained for Crypto Traders
The Ulcer Index (UI) is a technical analysis tool that measures downside risk. It helps traders understand the potential for losses by quantifying the depth and duration of price drawdowns.

Chaikin Volatility: A Comprehensive Guide for Crypto Traders
Chaikin Volatility is a technical analysis tool that measures the fluctuation of an asset's price over a given period. It helps traders understand market risk and potential trading opportunities by highlighting periods of increasing or decreasing price swings.