Biturai Trading Wiki
The ultimate crypto encyclopedia. Verified by experts.

Martingale Strategy in Crypto: A Deep Dive
The Martingale strategy is a trading approach that involves doubling your position size after each losing trade. While seemingly straightforward, it's a high-risk strategy, especially in the volatile crypto market, and requires careful consideration and risk management.

Flash Loan Arbitrage: A Biturai Guide for DeFi Traders
Flash loan arbitrage is a powerful trading strategy in decentralized finance (DeFi) that leverages uncollateralized loans to profit from price discrepancies across different exchanges. This guide provides a comprehensive overview of how it works, its risks, and its potential benefits for traders.

Momentum Trading in Cryptocurrencies: A Comprehensive Guide
Momentum trading is a strategy that capitalizes on the strength of recent price trends in the cryptocurrency market. It involves identifying and trading assets that are exhibiting strong upward or downward momentum, aiming to profit from the continuation of these trends.

Falling Wedge Pattern in Crypto Trading
The Falling Wedge is a bullish chart pattern suggesting a potential price reversal or continuation. It forms as price makes lower lows and lower highs within converging trendlines, eventually breaking upwards.
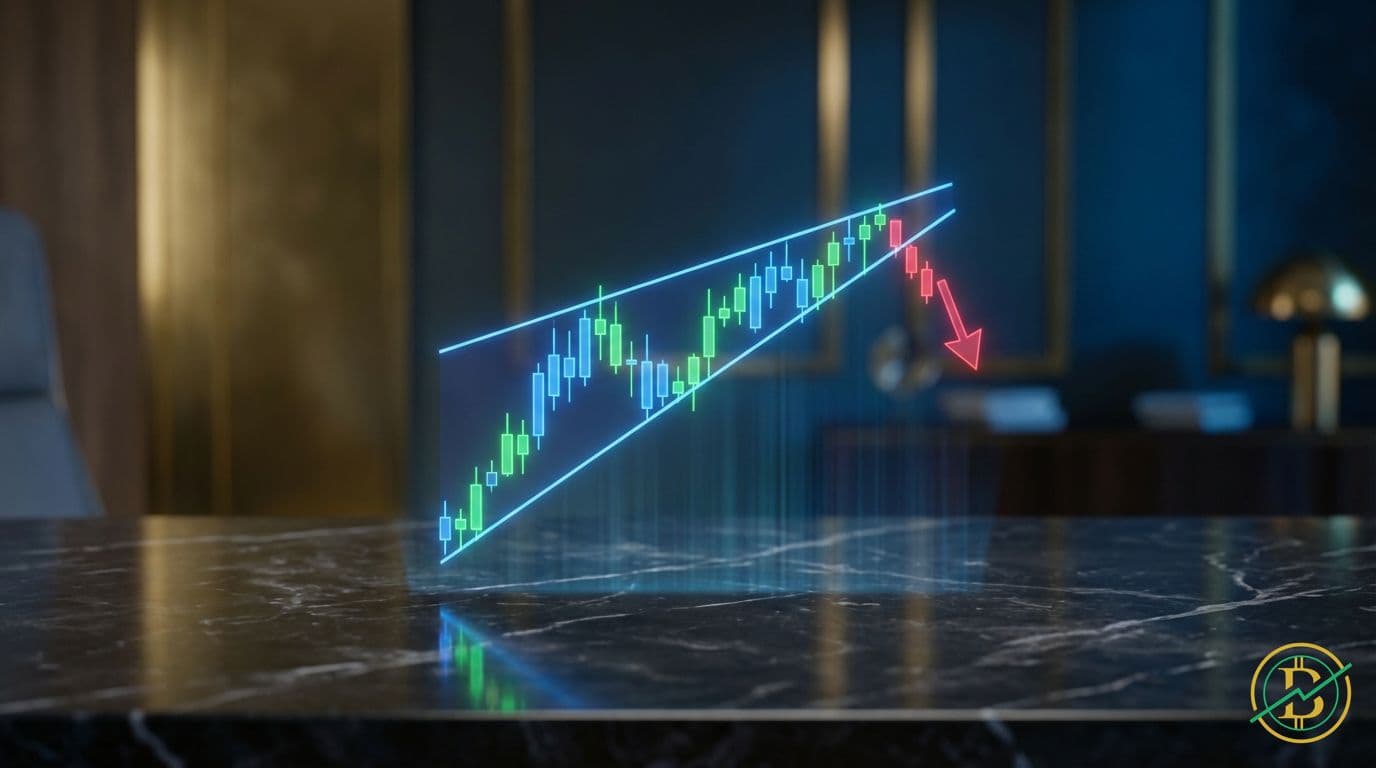
Rising Wedge Pattern in Cryptocurrency Trading
A rising wedge is a bearish chart pattern suggesting a potential price reversal. It forms when price consolidates within an upward-sloping channel, often signaling a coming decline.

Bull Flag Pattern: A Comprehensive Guide for Crypto Traders
The bull flag pattern is a bullish continuation pattern that suggests the current uptrend is likely to continue after a brief consolidation period. Understanding this pattern allows traders to identify potential entry points and capitalize on bullish momentum.

Three White Soldiers Candlestick Pattern
The Three White Soldiers is a bullish candlestick pattern, signaling a potential trend reversal from bearish to bullish. It's identified by three consecutive long, bullish candles, suggesting strong buying pressure and a shift in market sentiment.

Tweezer Bottom Pattern: A Comprehensive Guide
The Tweezer Bottom is a bullish reversal candlestick pattern, signaling a potential shift from a downtrend to an uptrend. It's formed by two candlesticks with similar low prices, suggesting that buying pressure is overcoming selling pressure.
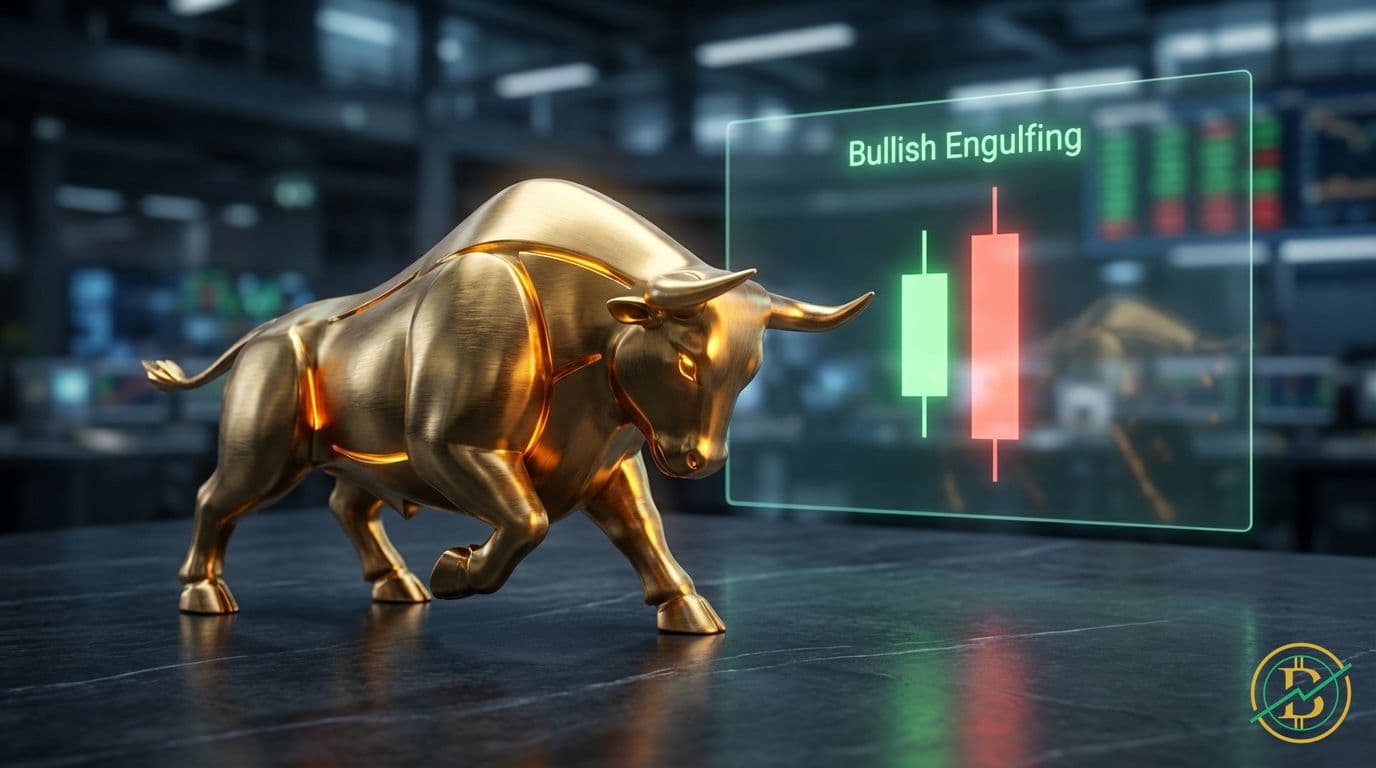
Bullish Engulfing Candlestick Pattern: A Comprehensive Guide
The Bullish Engulfing pattern is a powerful two-candlestick formation that hints at a potential trend reversal from bearish to bullish. This pattern appears at the end of a downtrend, suggesting that the buying pressure has overcome the selling pressure.

Hanging Man Candlestick Pattern: A Comprehensive Guide
The Hanging Man is a bearish reversal candlestick pattern that appears after an uptrend, signaling potential weakness. It suggests that buying momentum is fading, and a downtrend might be on the horizon.

Shooting Star Candlestick Pattern: A Comprehensive Guide
The Shooting Star is a bearish reversal candlestick pattern, signaling a potential price decline after an uptrend. It appears when the price of an asset rallies but then falls significantly, leaving a long upper wick and a small body.
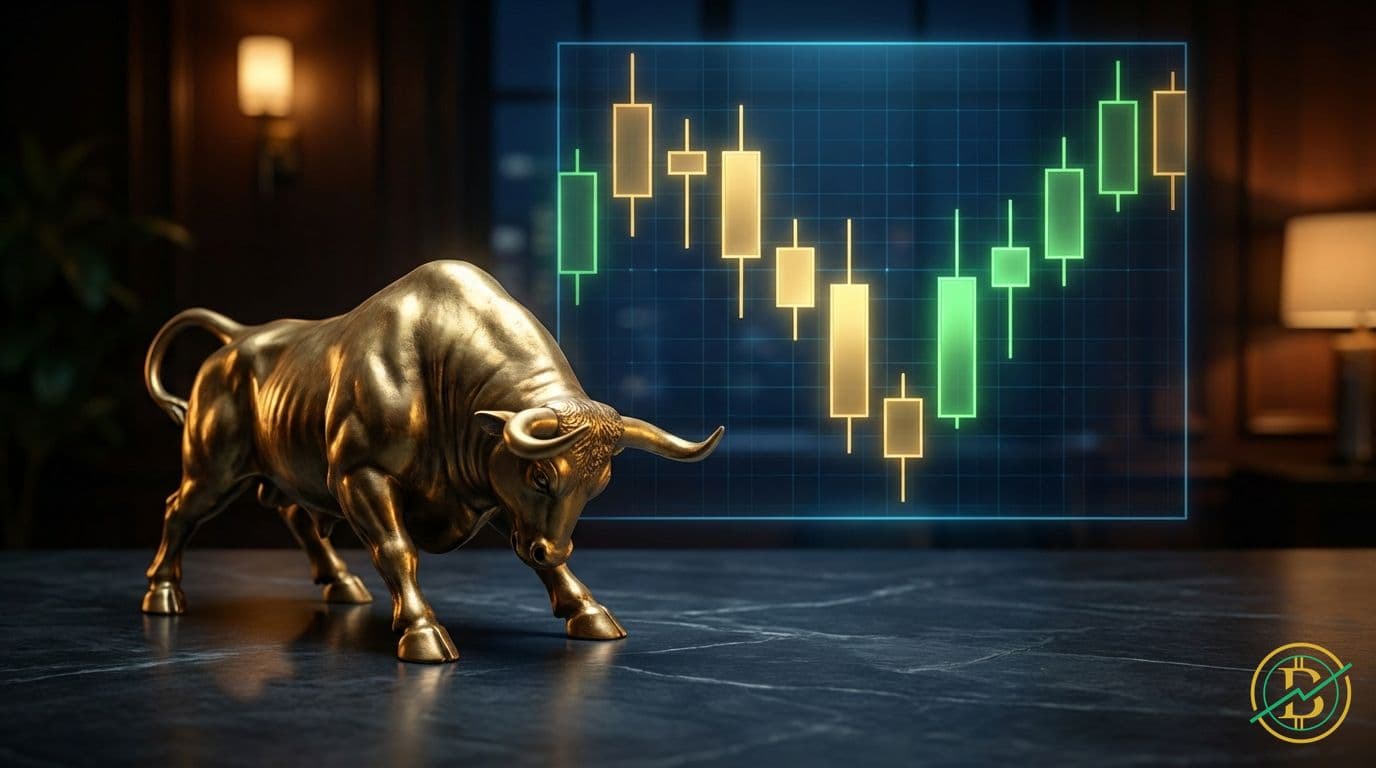
Morning Star: A Bullish Reversal Pattern in Crypto Trading
The Morning Star is a powerful bullish reversal candlestick pattern, signaling a potential end to a downtrend. This pattern is formed by three candles and can be a valuable tool for traders seeking to identify potential buying opportunities.

Pivot Points: Your Guide to Crypto Support and Resistance
Pivot points are technical analysis tools that help traders identify potential support and resistance levels on a price chart. Understanding and using pivot points can significantly improve your trading strategies by providing a framework for anticipating price movements.

Positive Volume Index (PVI): A Comprehensive Guide
The Positive Volume Index (PVI) is a technical indicator that helps traders identify trends by focusing on days with increased trading volume. It's based on the idea that 'smart money' often moves the market, and the PVI can help you spot their activity.

Negative Volume Index (NVI) Explained
The Negative Volume Index (NVI) is a technical analysis tool that helps traders understand price movements during periods of decreasing trading volume. It focuses on what happens when fewer people are trading, offering insights into potential market trends.

Volume Oscillator: Decoding Trading Volume Momentum
The Volume Oscillator (VO) is a technical analysis tool that helps traders understand the momentum of trading volume. It shows the difference between two moving averages of volume, revealing whether buying or selling pressure is increasing or decreasing.

Keltner Channel: A Comprehensive Guide for Crypto Traders
The Keltner Channel is a versatile technical analysis tool used by traders to gauge market volatility and identify potential trading opportunities. It visually represents price fluctuations within defined bands, helping to clarify trends and potential reversals.

Bollinger %B: A Comprehensive Guide for Crypto Traders
Bollinger %B is a crucial technical indicator that helps traders understand where the current price sits relative to the Bollinger Bands. It provides a straightforward way to identify potential overbought or oversold conditions, aiding in more informed trading decisions.

Know Sure Thing (KST): Crypto Momentum Mastery
The Know Sure Thing (KST) indicator is a momentum oscillator designed to identify potential trend reversals and trading signals in the market. It combines multiple moving averages of the Rate of Change (ROC) to smooth out price fluctuations, giving traders a clearer view of market momentum.

Chande Momentum Oscillator: A Deep Dive for Crypto Traders
The Chande Momentum Oscillator (CMO) is a technical analysis tool used to measure the momentum of an asset's price. It helps traders identify potential overbought and oversold conditions, aiding in decision-making.