Point and Figure Charting: A Timeless Crypto Trading Tool
Point and Figure charting is a unique method of visualizing price movements, focusing on changes in price direction rather than time. This approach helps traders identify trends and potential entry/exit points, making it a valuable tool for analyzing crypto assets.
Point and Figure Charting: A Timeless Crypto Trading Tool
Definition: Point and Figure (P&F) charting is a classic technical analysis method that visualizes price movements without considering time. Instead of showing price changes over a specific period, it focuses on price direction – up or down. Think of it as a simplified way to track the battle between buyers and sellers, where the chart only updates when the price makes a significant move.
Key Takeaway: Point and Figure charts help traders identify trends and potential trading opportunities by focusing on price direction and ignoring time.
Mechanics: How Point and Figure Charts Work
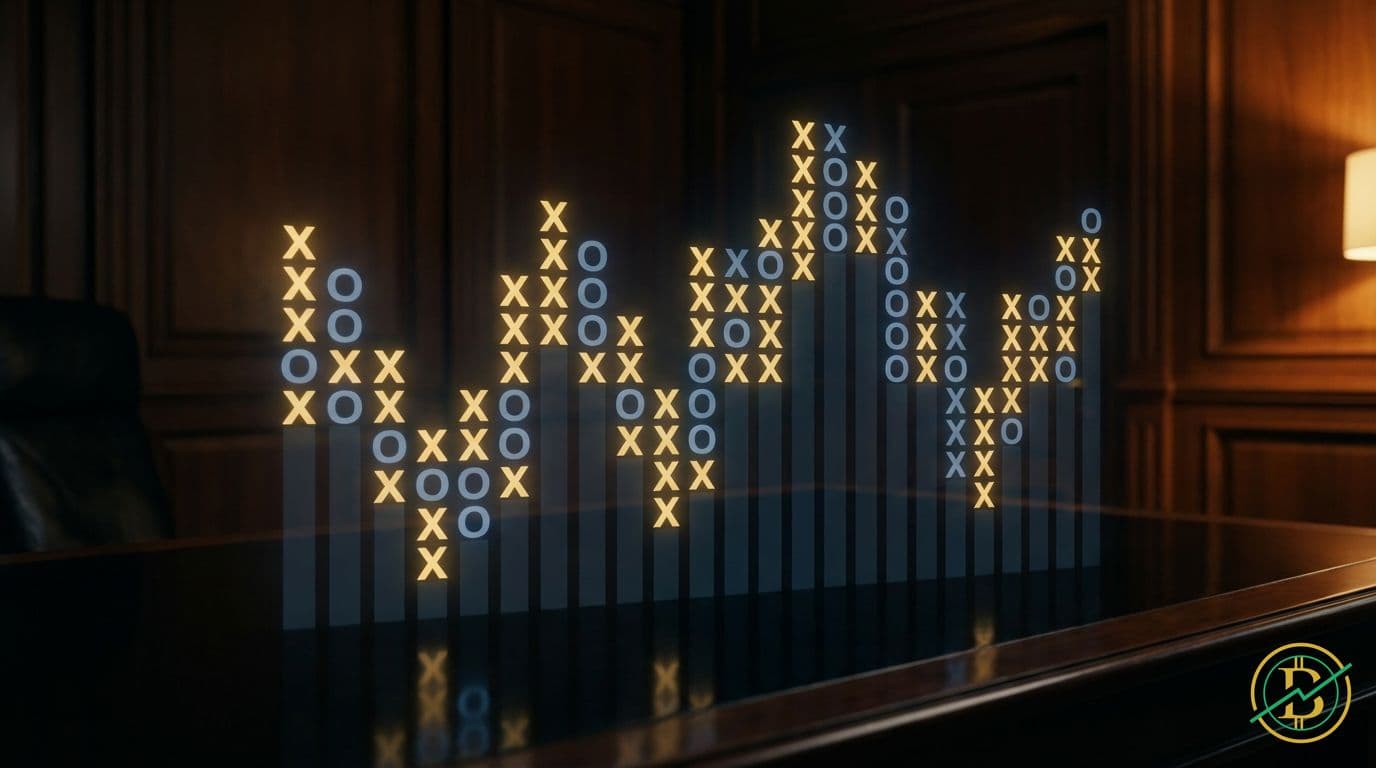
The creation of a P&F chart is surprisingly straightforward. It uses two symbols: 'X' to represent rising prices and 'O' to represent falling prices. The core elements are:
- Box Size: This is the smallest price increment that triggers a new entry on the chart. For example, a box size of $10 for Bitcoin means that the price needs to move up or down by $10 to warrant a new 'X' or 'O'. The box size is critical; it filters out noise and focuses on significant price movements.
- Reversal Amount: This determines how much the price needs to reverse (move in the opposite direction) to warrant a new column. A common reversal amount is three times the box size. So, if the box size is $10, a $30 reversal is needed to change the column from 'X' to 'O' or vice versa.
- Chart Construction: The chart is built column by column. When the price moves up by the box size, an 'X' is added to the current column. When the price reverses by the reversal amount, a new column is started with 'O's. The process repeats, creating a visual representation of price action.
In essence: Price goes up, you add 'X's. Price reverses significantly, you start a new column with 'O's. The chart is built based on these movements.
Let’s illustrate with an example:
- Box Size: $10
- Reversal: 3 boxes ($30)
- Price rises from $100 to $110: An 'X' is added to the chart.
- Price rises to $120, $130: More 'X's are added to the same column.
- Price falls to $100: Not enough of a reversal, nothing changes.
- Price falls to $90: Still no change.
- Price falls to $80: Still no change.
- Price falls to $70: Now, a $30 reversal has occurred. A new column of 'O's is started.
This simple system filters out minor price fluctuations, highlighting the more significant trends.
Trading Relevance: Identifying Trends and Opportunities
Point and Figure charts are excellent for identifying trends, support and resistance levels, and potential breakout points. Here's how traders use them:
- Trend Identification: A series of 'X' columns indicates an uptrend, while a series of 'O' columns indicates a downtrend. The longer the sequence of 'X's or 'O's, the stronger the trend is presumed to be. This is similar to how we identify trends in other forms of technical analysis.
- Support and Resistance: Horizontal lines can be drawn across the columns to identify potential support and resistance levels. These levels often align with the highs and lows of the 'X' and 'O' columns. Breakouts above resistance or breakdowns below support can signal potential trading opportunities.
- Breakout Patterns: P&F charts reveal classic patterns like bullish breakouts (a series of 'X' columns breaking above a previous resistance level) and bearish breakdowns (a series of 'O' columns breaking below a support level). These patterns provide clear trading signals.
- Price Targets: Traders can use the chart to project potential price targets. A common method is to measure the width of a pattern (like a bullish rectangle) and project that distance from the breakout point. This is a basic form of pattern projection.
- Entry and Exit Points: Traders often use P&F charts to determine entry and exit points. For example, a trader might enter a long position after a bullish breakout and exit when the trend shows signs of weakness (like a series of 'O's appearing). Similarly, a short position might be entered after a bearish breakdown.
Risks of Point and Figure Charting
While P&F charting is a powerful tool, it's essential to be aware of its limitations:
- Lagging Indicator: P&F charts are inherently lagging indicators. They only show trends after they have started, as they need a price movement to confirm the trend. This means you might miss the very beginning of a move.
- Subjectivity: The choice of box size and reversal amount can be subjective. Different choices can result in different chart interpretations, which can lead to conflicting signals. This is why backtesting and experience are critical.
- False Signals: Like all technical analysis methods, P&F charts can generate false signals. A breakout can fail, or a trend can reverse unexpectedly. Risk management is crucial to protect your capital.
- Volatility: In highly volatile markets, the chart can change rapidly, leading to whipsaws (rapid changes from 'X' to 'O' and back). This can be particularly problematic in crypto markets, where volatility is common.
- Not a Standalone Tool: P&F charts are best used in conjunction with other forms of analysis, such as fundamental analysis and other technical indicators, to confirm signals and make informed trading decisions.
History and Real-World Examples
Point and Figure charting has a long and storied history, dating back to the late 19th century. It predates many modern technical analysis tools and was initially used by stock traders.
- Early Adoption: The method gained popularity in the early 20th century. It was especially useful in the days before computers, when traders needed a simple and visual way to track market movements.
- Evolution: Over time, traders refined the techniques, developing various patterns and strategies.
- Modern Relevance: Despite the rise of sophisticated charting software, P&F charting remains relevant. Its simplicity and clarity make it useful for identifying long-term trends and potential trading opportunities.
Examples in Crypto:
- Bitcoin's 2021 Bull Run: During Bitcoin's massive price increase in 2021, a P&F chart would have clearly shown a series of 'X' columns, identifying the strong uptrend. Traders could have used this to stay in the trade and identify potential support levels.
- Ethereum's Consolidation Phases: P&F charts are useful for identifying periods of sideways price movement, often seen in Ethereum. The chart would show a series of 'X' and 'O' columns, highlighting the consolidation before the next significant move.
- Altcoin Breakouts: P&F charting can be used to identify potential breakout points in altcoins. A bullish breakout pattern could signal a buying opportunity, while a bearish breakdown could signal a selling opportunity.
Conclusion
Point and Figure charting is a valuable, yet often overlooked, tool in the crypto trader's arsenal. Its focus on price direction makes it an effective way to identify trends, support and resistance levels, and potential trading opportunities. While it has limitations, particularly as a lagging indicator, its simplicity and clarity make it a worthwhile addition to any trader's toolkit. Remember to always combine it with other forms of analysis and practice robust risk management.
⚡Trading Benefits
20% CashbackLifetime cashback on all your trades.
- 20% fees back — on every trade
- Paid out directly by the exchange
- Set up in 2 minutes
Affiliate links · No extra cost to you
20%
Cashback
Example savings
$1,000 in fees
→ $200 back