OHLCV: Understanding Crypto Market Data
OHLCV data is the cornerstone of technical analysis in cryptocurrency trading, providing a concise snapshot of price movements over time. By understanding Open, High, Low, Close, and Volume, traders can gain valuable insights into market sentiment and potential trading opportunities.
OHLCV: Understanding Crypto Market Data
Definition:
OHLCV stands for Open, High, Low, Close, and Volume. It's a fundamental dataset used in financial markets, including cryptocurrencies, to represent price movements of an asset over a specific period. Think of it as a detailed report card for a cryptocurrency's price activity during a set timeframe, like an hour, a day, or even a minute.
Key Takeaway: OHLCV data provides a comprehensive view of price action, enabling traders to analyze market trends and identify potential trading opportunities.
Mechanics: OHLCV data is generated for each time interval (e.g., a 1-hour candle) from the trades that occur within that period. Here's a breakdown of each component:
- Open (O): The price at which the asset first traded at the beginning of the period. Imagine the opening bell of a stock exchange; the first trade sets the 'Open' price.
- High (H): The highest price the asset reached during the period. This represents the peak of buying interest or a temporary surge in price.
- Low (L): The lowest price the asset reached during the period. This signifies the lowest point of selling pressure or a dip in price.
- Close (C): The price at which the asset last traded at the end of the period. This is considered a crucial indicator of market sentiment, as it reflects the final price agreement between buyers and sellers.
- Volume (V): The total amount of the asset traded during the period. Volume is a crucial component, as it indicates the level of activity and interest in the asset. High volume often confirms a price trend, while low volume may suggest a lack of conviction.
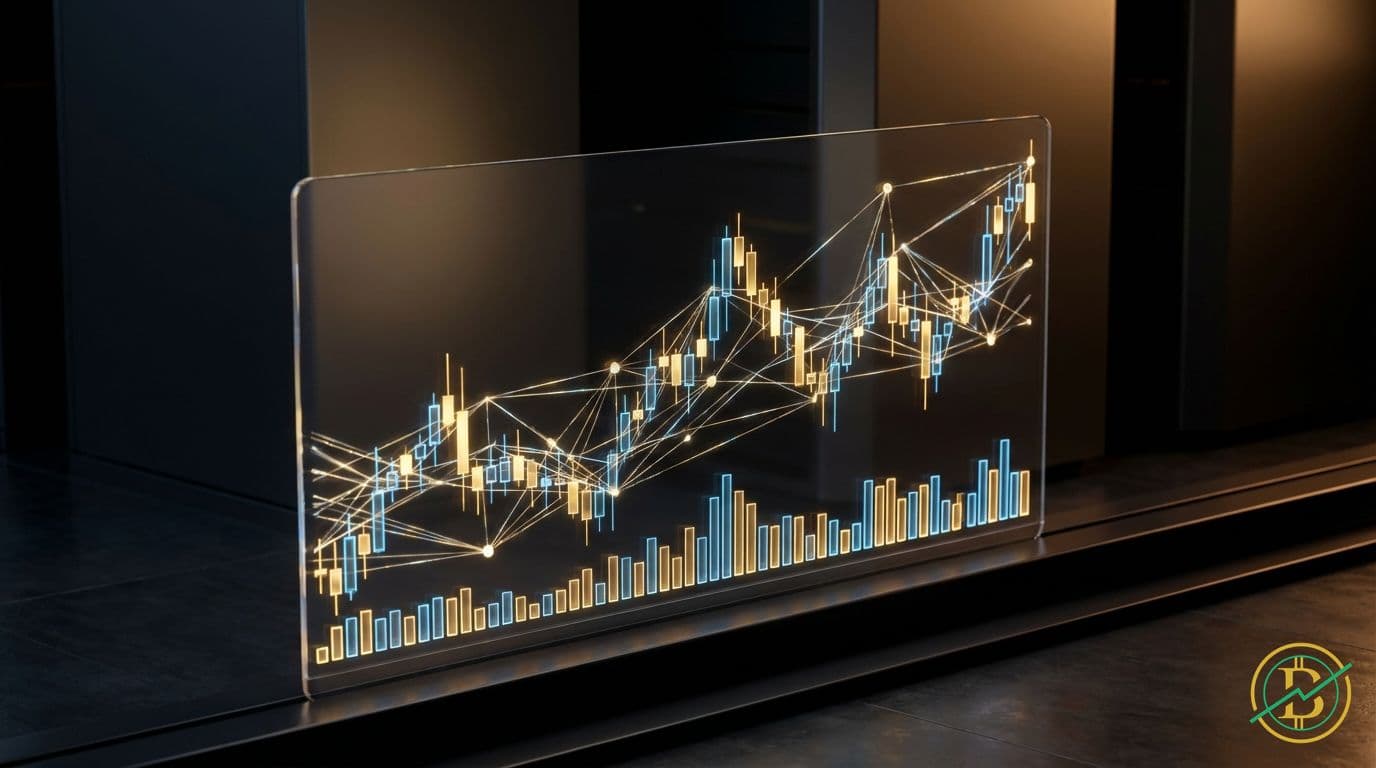
These five data points are typically visualized using candlestick charts or bar charts. Each candle or bar represents a single time period. The body of the candle (or bar) shows the range between the Open and Close prices. The wicks (or shadows) show the High and Low prices. The color of the body indicates whether the price went up (usually green or white, indicating a higher Close than Open) or down (usually red or black, indicating a lower Close than Open).
Trading Relevance: Understanding OHLCV data is crucial for technical analysis, a method of evaluating investments by analyzing statistics generated by market activity, such as past prices and volume. Here's how traders use OHLCV data:
- Trend Identification: Traders use OHLCV data to identify trends. For instance, a series of candles with higher highs and higher lows suggests an uptrend, while lower highs and lower lows indicate a downtrend. Technical indicators like Moving Averages, which are derived from OHLCV data, provide further confirmation of trends.
- Pattern Recognition: Candlestick patterns, formed by the relationships between OHLCV data points, can signal potential reversals or continuations of trends. Examples include the doji (indicating indecision), the hammer (potential bullish reversal), and the shooting star (potential bearish reversal).
- Support and Resistance Levels: The High and Low prices of previous periods can help traders identify potential support and resistance levels. Support is a price level where buying interest is expected to be strong enough to prevent the price from falling further, while resistance is a price level where selling pressure is expected to be strong enough to prevent the price from rising further.
- Volume Analysis: Volume confirms the strength of a trend. High volume on a breakout (when the price moves above a resistance level or below a support level) suggests a strong move, while low volume may indicate a false breakout.
- Entry and Exit Points: Traders use OHLCV data to determine entry and exit points for trades. For example, a trader might enter a long position (buy) when they see a bullish candlestick pattern at a support level, and exit the position (sell) when the price reaches a resistance level.
Risks:
- Data Accuracy: Ensure the source of your OHLCV data is reliable. Inaccurate data can lead to poor trading decisions. Some exchanges or data providers may have issues with data integrity, especially on smaller exchanges. Always verify your data source.
- Lagging Indicators: Technical indicators based on OHLCV data are lagging indicators, meaning they reflect past price action. They don't predict the future, but rather, provide context to historical performance. Relying solely on lagging indicators can lead to delayed reactions to market changes.
- Market Manipulation: Be aware of potential market manipulation. Large players can sometimes influence the OHLCV data to create false signals. Volume analysis can help identify potential manipulation, but it's not foolproof.
- Over-reliance: Don't rely solely on OHLCV data. Combine it with other forms of analysis, such as fundamental analysis (which looks at the underlying value of an asset) and risk management strategies.
History/Examples:
- Early Stock Markets: OHLCV charts have been used in traditional financial markets for centuries. The earliest forms of technical analysis, using charts to track price movements, predate the advent of computers. The concepts were later adapted to the cryptocurrency market.
- Bitcoin's Early Days: In the early days of Bitcoin (2009-2012), OHLCV data was crucial for understanding price movements, because there were fewer sources of information. Early adopters and traders relied heavily on candlestick charts to identify trends and potential trading opportunities.
- Modern Crypto Trading: Today, OHLCV data is available in real-time from numerous sources, including exchanges, data providers (like CoinAPI and Amberdata), and charting platforms. The availability of real-time data has enabled the development of sophisticated trading algorithms and automated trading systems that rely on OHLCV analysis.
- Example Candlestick Pattern: Imagine a 'bullish engulfing' pattern: This pattern occurs when a green candle completely engulfs the previous red candle. This pattern strongly suggests a potential bullish reversal, offering a buy signal for traders.
By carefully studying OHLCV data, traders can better understand the dynamics of the cryptocurrency market and make more informed trading decisions. This data provides the raw ingredients necessary to analyze the market and devise a successful trading strategy.
⚡Trading Benefits
20% CashbackLifetime cashback on all your trades.
- 20% fees back — on every trade
- Paid out directly by the exchange
- Set up in 2 minutes
Affiliate links · No extra cost to you
20%
Cashback
Example savings
$1,000 in fees
→ $200 back