Doji Candlestick Pattern: A Comprehensive Guide to Market Indecision
The Doji candlestick pattern signals market indecision, where the opening and closing prices are nearly identical. Understanding Dojis can significantly improve your ability to identify potential trend reversals and make informed trading decisions.
Doji Candlestick Pattern: A Comprehensive Guide
INTRO: The world of cryptocurrency trading is full of ups and downs, represented on charts by colored bars called candlesticks. These candlesticks tell a story about price movements: the opening price, the closing price, the highest price reached, and the lowest price reached during a specific time period. One particular type of candlestick, the Doji, has a special meaning: it signifies that the forces of buyers and sellers are roughly equal, leading to market indecision.
Definition
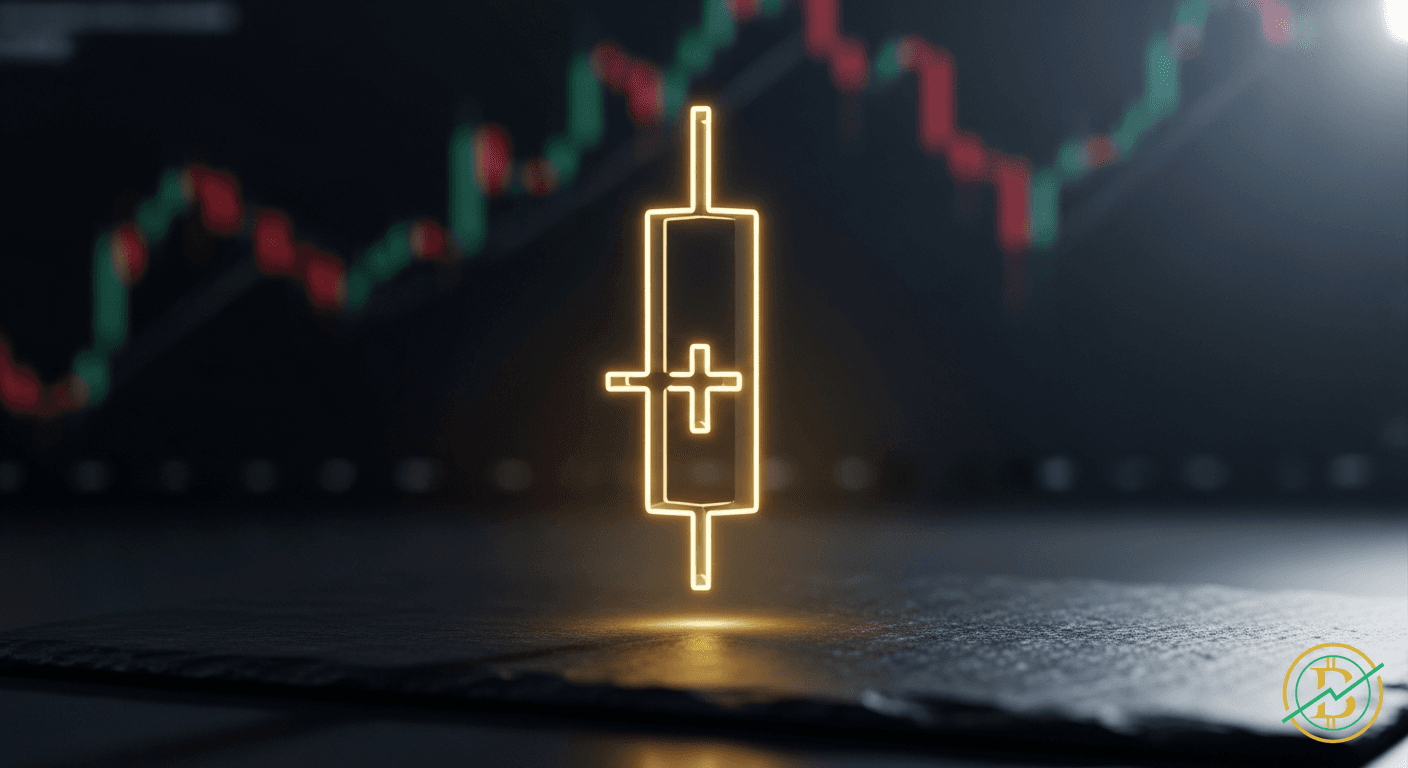
A Doji is a candlestick pattern characterized by an opening and closing price that are virtually the same. It appears as a thin horizontal line or cross shape on a price chart.
Key Takeaway: The Doji candlestick pattern indicates market indecision and potential reversal opportunities.
Mechanics
Imagine a tug-of-war. The rope represents the price of an asset, and the teams are the buyers (who want the price to go up) and the sellers (who want the price to go down). A Doji forms when both teams are equally strong, and the rope doesn't move much during the specified time period. The opening and closing prices are essentially at the same level. The “shadows” or wicks on the Doji represent the highest and lowest prices reached during that period. Different types of Dojis exist, each with slight variations in their appearance and implications.
Types of Doji:
- Standard Doji: The most common type, with a horizontal line indicating the open and close are at the same level. The wicks (high and low) can vary in length.
- Long-Legged Doji: Has long upper and lower shadows, showing a high degree of volatility during the period. This suggests a greater struggle between buyers and sellers.
- Dragonfly Doji: Looks like a “T” or a dragonfly. It has a long lower shadow and the open, close, and high prices are all at the same level. This is often considered a bullish reversal signal, especially if it appears at the bottom of a downtrend.
- Gravestone Doji: Looks like an inverted “T”. It has a long upper shadow and the open, close, and low prices are at the same level. This is often considered a bearish reversal signal, especially if it appears at the top of an uptrend.
- Four Price Doji: A very rare formation where the open, high, low, and close prices are all identical, forming a horizontal line. This usually occurs during periods of extremely low trading volume or due to a data error.
Trading Relevance
The Doji itself is not a trading signal, but rather a warning sign. It signals that the existing trend might be losing momentum. The implication is that the prevailing trend could reverse, or at least pause, as buyers and sellers are in equilibrium. Traders watch for confirmation after a Doji forms before making any trading decisions.
Confirmation is Key:
- Bullish Confirmation: If a Doji appears after a downtrend, a bullish confirmation would be a subsequent candlestick closing above the Doji's high with above-average volume. This suggests buyers have taken control.
- Bearish Confirmation: If a Doji appears after an uptrend, a bearish confirmation would be a subsequent candlestick closing below the Doji's low with above-average volume. This suggests sellers have taken control.
Context Matters: The significance of a Doji depends heavily on the context of the price chart. Its location relative to support and resistance levels, trend lines, and other technical indicators is crucial for interpretation.
Volume as a Filter: Always consider volume. A Doji followed by a confirmation candle with strong volume suggests a higher probability of a trend reversal. Low volume suggests the indecision might continue.
Risks
- False Signals: Dojis, especially the standard Doji, can generate false signals. Always confirm the pattern with other indicators or price action.
- Market Volatility: Crypto markets are highly volatile. A Doji can quickly be invalidated by a sudden price movement. Set stop-loss orders to manage risk.
- Over-Reliance: Do not rely solely on Doji patterns for trading decisions. Use them in conjunction with other technical analysis tools and fundamental analysis.
History/Examples
Dojis have been observed in financial markets for centuries. They are a fundamental concept of candlestick charting, which originated in Japan in the 18th century. Though the exact history of the Doji candlestick pattern is not well-documented, the pattern has been used in stock, forex, and commodity markets for a long time. They have been applied to crypto trading since the inception of Bitcoin. Here are some examples:
- Bitcoin in 2021: During the bull run of 2021, numerous Doji patterns appeared on Bitcoin's chart, often preceding minor pullbacks or consolidations. The significance of each Doji depended on the surrounding price action and the confirmation that followed.
- Dragonfly Doji at Support: Imagine a Dragonfly Doji forming on Ethereum near a significant support level. This could signal a potential bullish reversal, and traders might look for a confirmation candle closing above the Doji's high to enter a long position.
- Gravestone Doji at Resistance: If a Gravestone Doji forms on a chart after a strong price rise near a resistance level, it could signal an upcoming reversal, and traders might look for a confirmation candle closing below the Doji's low to enter a short position.
Understanding the Doji pattern is a starting point for any serious crypto trader. By observing the balance of power between buyers and sellers, traders can gain a deeper understanding of market sentiment and make more informed decisions.
⚡Trading Benefits
20% CashbackLifetime cashback on all your trades.
- 20% fees back — on every trade
- Paid out directly by the exchange
- Set up in 2 minutes
Affiliate links · No extra cost to you
20%
Cashback
Example savings
$1,000 in fees
→ $200 back