Crypto Depth Chart: A Comprehensive Guide
A crypto depth chart visualizes the **supply** and **demand** for an asset at different price levels, offering insights into market sentiment and potential price movements. Understanding depth charts empowers traders to make informed decisions by identifying support and resistance levels, and assessing the market's ability to absorb large orders.
Crypto Depth Chart: A Comprehensive Guide
Definition: A crypto depth chart is a visual representation of the order book on a cryptocurrency exchange. It displays the quantity of buy and sell orders at various price levels, providing a snapshot of the supply and demand dynamics for a specific cryptocurrency.
Key Takeaway: Depth charts help traders understand the current market sentiment and potential price movements by visualizing the concentration of buy and sell orders.
Mechanics: Deconstructing the Depth Chart
At its core, a depth chart is a graphical depiction of the order book. The order book is a list of all open buy and sell orders for a specific crypto asset on an exchange. The depth chart visualizes this data, typically using two main components:
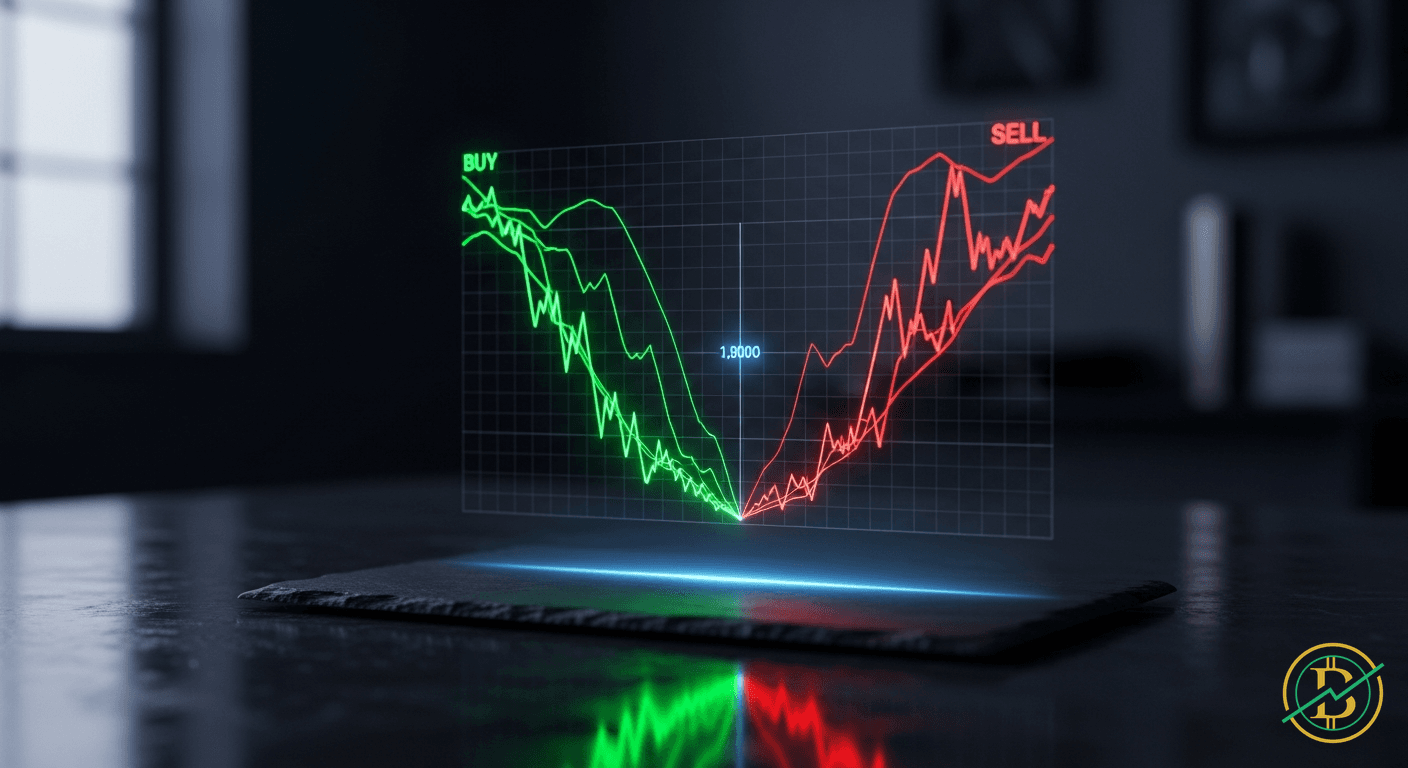
- The Buy Side (Bids): This represents the cumulative buy orders. It shows the number of buyers willing to purchase the asset at different price points. The higher the price, the more buyers there might be, as they anticipate an increase in value.
- The Sell Side (Ask): This shows the cumulative sell orders. It displays the number of sellers willing to sell the asset at different price levels. The higher the price, the more sellers might be willing to sell, as they look to capitalize on the asset's value.
The chart itself often takes the form of a graph. The horizontal axis (X-axis) typically represents the price, while the vertical axis (Y-axis) represents the quantity of the asset being traded. The buy orders are usually plotted on the left side of the chart, and the sell orders are on the right. The depth of the chart refers to the volume of orders at each price point. A deeper chart suggests a more liquid market, with a greater number of orders at various price levels.
Buy and Sell Walls
An important concept within depth charts is the idea of buy walls and sell walls. These are areas on the chart where a large number of orders are concentrated at a specific price level.
- Buy Walls: A buy wall occurs when there's a significant concentration of buy orders at a specific price. This can act as a support level, potentially preventing the price from falling below that point. Traders may interpret this as a signal of strong buying interest, suggesting that many investors believe the asset is undervalued at that price.
- Sell Walls: Conversely, a sell wall is a concentration of sell orders at a certain price. This can act as a resistance level, potentially preventing the price from rising above that point. Traders may view a sell wall as an indication of strong selling pressure, where many holders are keen to sell at that price point.
Interpreting the Data
Reading a depth chart involves understanding the interplay between buy and sell orders. Here’s how to interpret the data:
- Support and Resistance: Identify potential support and resistance levels by looking for buy and sell walls. Strong buy walls can suggest potential support, while strong sell walls can indicate potential resistance.
- Market Sentiment: Assess the general market sentiment. If there are more buy orders than sell orders at the current price, the sentiment may be bullish. If there are more sell orders, the sentiment may be bearish.
- Liquidity: Evaluate the liquidity of the market. A market with a deeper chart, displaying a large number of orders at various price levels, is generally considered more liquid. This means that large orders can be executed with less price slippage.
- Order Book Imbalance: Look for imbalances between buy and sell orders. A significant imbalance could indicate a potential price move in the direction of the dominant order type.
Trading Relevance: Using Depth Charts for Informed Decisions
Depth charts provide invaluable insights for traders to make informed decisions. Here's how they can be applied:
- Identifying Support and Resistance Levels: Locate potential support and resistance levels by observing buy and sell walls. This helps traders determine entry and exit points for their trades. Buying near a support level with a significant buy wall can be a strategy, while selling near a resistance level with a sell wall is another.
- Assessing Market Sentiment: Gauge the overall market sentiment. If there's a strong buying interest, traders might anticipate an upward price movement. Conversely, strong selling interest may suggest a potential price decline.
- Predicting Price Movements: Anticipate potential price movements by analyzing the size and concentration of orders. For example, a large buy order at a specific price may suggest that the price might not fall below that level.
- Order Placement: Determine the optimal price to place your own orders. By observing the order book, traders can identify price levels where there is a high probability of their orders being filled.
- Risk Management: Understand the potential impact of large orders on price. This allows traders to manage their risk effectively by setting stop-loss orders and take-profit targets.
Risks: Potential Pitfalls
While depth charts are useful, it’s important to be aware of the associated risks and limitations:
- Order Book Manipulation: Large market participants can manipulate the order book to create the illusion of support or resistance. This can mislead traders into making incorrect decisions. For instance, a trader might place a large buy order to create a 'buy wall', intending to trigger a buying frenzy and then sell their holdings at a higher price.
- False Signals: Depth charts, like other technical indicators, can generate false signals. The market can behave unpredictably, and relying solely on depth charts can lead to losses.
- Limited Scope: Depth charts only provide a snapshot of the order book at a specific moment. They don’t consider other factors that can influence price, such as news events, macroeconomic conditions, or overall market trends.
- Hidden Orders: Some orders, such as iceberg orders, are designed to hide the full size of a trade. This can make the depth chart less accurate, as it does not reflect the true buying or selling pressure.
- Market Volatility: In volatile markets, the order book can change rapidly. This can make it difficult to make accurate predictions based on the depth chart. The positions of buy and sell walls can shift dramatically in a short period.
History and Examples
Depth charts have become a standard tool for crypto traders. The concept originates from traditional financial markets, where order books are used to track supply and demand. In the early days of Bitcoin and other cryptocurrencies, the order books were relatively shallow, making price manipulation easier. As the crypto market has matured, exchanges have introduced more advanced tools, including more sophisticated depth charts.
Examples
- Bitcoin in 2017: During the 2017 Bitcoin bull run, strong buy walls often formed at key price levels, acting as support and fueling the price increase. Traders used these buy walls to anticipate potential bounces and enter long positions.
- Ethereum during ICO boom: During the initial coin offering (ICO) boom, sell walls often formed at prices where ICO tokens were being distributed. Traders watched these sell walls for potential resistance, using this information to plan their exit strategies.
- Market Manipulation: In some cases, traders have attempted to manipulate the market by placing large buy or sell orders to create the illusion of support or resistance. These actions are designed to influence the price and take advantage of other traders' positions.
Conclusion
A crypto depth chart is a valuable tool for understanding market dynamics and making informed trading decisions. By visualizing the order book, traders can gain insights into supply, demand, and market sentiment. While depth charts have limitations and risks, understanding how to read and interpret them is an essential skill for any serious crypto trader.
⚡Trading Benefits
20% CashbackLifetime cashback on all your trades.
- 20% fees back — on every trade
- Paid out directly by the exchange
- Set up in 2 minutes
Affiliate links · No extra cost to you
20%
Cashback
Example savings
$1,000 in fees
→ $200 back