Candlestick Charts in Crypto: A Beginner's Guide
Candlestick charts are a fundamental tool for analyzing price movements in the cryptocurrency market. They visually represent price fluctuations over time, allowing traders to identify potential trends and make informed decisions.
Candlestick Charts: Understanding Crypto Price Action
Definition: Candlestick charts are a graphical representation of price movements over a specific period. They are a core tool for understanding and analyzing the fluctuating prices of cryptocurrencies.
Key Takeaway: Candlestick charts provide a visual way to understand price action, helping traders identify potential trends and make informed trading decisions.
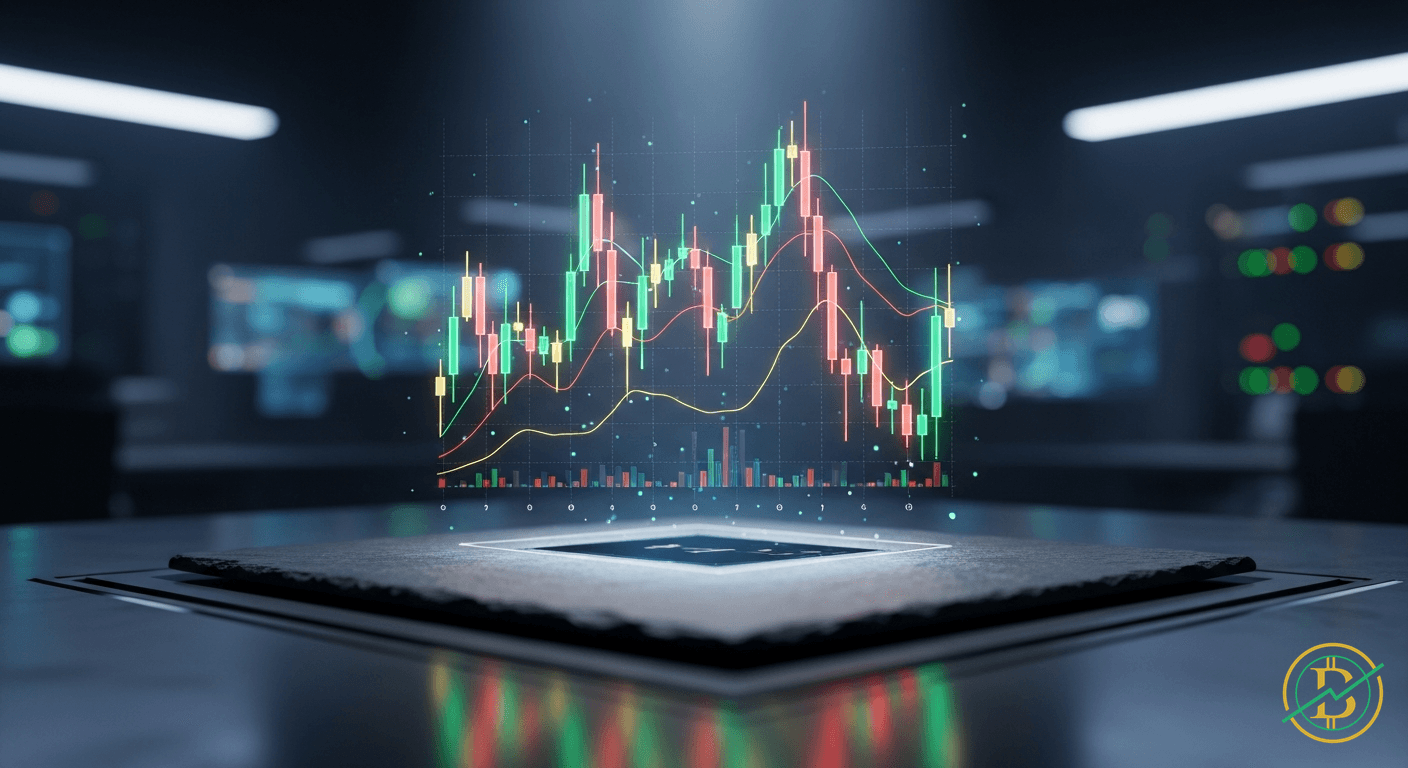
Mechanics: How Candlesticks Work
Each candlestick represents the price action for a specific time frame, such as a minute, an hour, or a day. The 'body' of the candlestick shows the difference between the opening price and the closing price for that period. The 'wicks' (also called shadows) extending above and below the body indicate the high and low prices reached during that period.
Opening Price: The price at which an asset begins trading at the start of the defined period. Closing Price: The price at which an asset is trading at the end of the defined period. High: The highest price reached by the asset during the defined period. Low: The lowest price reached by the asset during the defined period.
The color of the candlestick body tells us whether the price went up or down during the period. Typically:
- A green or white candlestick indicates the closing price was higher than the opening price (a bullish signal).
- A red or black candlestick indicates the closing price was lower than the opening price (a bearish signal).
Let's break it down further. Imagine a one-hour candlestick chart for Bitcoin. If the price opened at $30,000 and closed at $30,500, the body would be green, and the candlestick represents a positive price movement. If, however, the price opened at $30,500 and closed at $30,000, the body would be red, and the candlestick demonstrates a negative price movement.
The wicks provide additional information. If during that hour, Bitcoin briefly hit $30,700, the upper wick would extend upwards to that level. If it dipped to $29,800, the lower wick would extend down to that level. These wicks show the range of price volatility within that timeframe.
Candlestick charts can display various timeframes, from one minute to one month. Shorter timeframes (e.g., 1-minute, 5-minute) are used for day trading and provide more granular data. Longer timeframes (e.g., daily, weekly, monthly) offer a broader perspective on long-term trends.
Trading Relevance: Reading the Signals
Candlestick charts are not just pretty pictures; they are powerful tools for traders. By analyzing candlestick patterns, traders can gain insights into market sentiment and anticipate future price movements.
Candlestick patterns are formations of one or more candlesticks that can signal potential trend reversals or continuations. Some common patterns include:
- Bullish Engulfing: A two-candlestick pattern where a large green candlestick completely 'engulfs' a smaller red candlestick, suggesting a potential bullish reversal.
- Bearish Engulfing: A two-candlestick pattern where a large red candlestick 'engulfs' a smaller green candlestick, indicating a potential bearish reversal.
- Hammer: A candlestick with a small body and a long lower wick, often signaling a potential bullish reversal after a downtrend.
- Shooting Star: A candlestick with a small body and a long upper wick, often indicating a potential bearish reversal after an uptrend.
Traders use these patterns, combined with other technical indicators and fundamental analysis, to make informed trading decisions. For example, a trader might see a bullish engulfing pattern at a key support level, indicating a potential buying opportunity. Conversely, a bearish engulfing pattern at a resistance level might suggest a selling opportunity.
Candlestick analysis also helps to identify support and resistance levels. Support levels are price points where buying pressure is expected to be strong enough to prevent the price from falling further. Resistance levels are price points where selling pressure is expected to be strong enough to prevent the price from rising further. These levels can be identified by observing where candlesticks repeatedly bounce off of (support) or fail to break through (resistance).
Risks: Navigating the Market
While candlestick charts are valuable, they are not a foolproof system. It is important to remember:
- False Signals: Candlestick patterns can sometimes generate false signals. A pattern might appear to indicate a trend reversal, but the price may continue in its original direction.
- Market Volatility: The crypto market is highly volatile. Unexpected news, regulatory changes, or market manipulation can rapidly change price action, rendering candlestick patterns less reliable.
- Confirmation is Key: Always confirm candlestick patterns with other indicators and analysis tools. Relying solely on candlestick patterns can lead to poor trading decisions.
- Timeframe Dependence: The reliability of a candlestick pattern can vary depending on the timeframe. What looks significant on a 1-minute chart might be insignificant on a daily chart.
Risk management is crucial. Always use stop-loss orders to limit potential losses. Never invest more than you can afford to lose. Be patient and disciplined in your trading.
History/Examples: Real-World Applications
Candlestick charts have been used in financial markets for centuries. Their origins trace back to 18th-century Japan, where rice traders used them to track price movements. The same principles apply to the crypto market today.
Consider the early days of Bitcoin. In 2011, when Bitcoin was still relatively unknown, candlestick charts would have revealed volatile price swings. Observing patterns like hammers and shooting stars could have provided early signals about potential price reversals, although the market was far less mature at that time. As Bitcoin gained mainstream adoption, the patterns became more complex, with more traders participating.
In 2021, during the bull run, candlestick charts were essential for traders. The rapid price increases and decreases were clearly visible, and patterns like bullish engulfing and bearish engulfing often signaled significant price movements. Traders who understood and utilized these patterns were better equipped to navigate the market.
Today, candlestick charts remain essential for crypto traders of all levels. They provide a visual language for understanding price action, helping traders make informed decisions and manage risk effectively. The ability to read and interpret these charts is a fundamental skill for anyone serious about trading cryptocurrencies.
⚡Trading Benefits
20% CashbackLifetime cashback on all your trades.
- 20% fees back — on every trade
- Paid out directly by the exchange
- Set up in 2 minutes
Affiliate links · No extra cost to you
20%
Cashback
Example savings
$1,000 in fees
→ $200 back