5-Minute Chart: Decoding Crypto Price Action
The 5-minute chart is a crucial tool for day traders and short-term investors, offering a granular view of price movements. Understanding this chart allows you to identify immediate trends, spot potential entry and exit points, and refine your trading strategies.
5-Minute Chart: Decoding Crypto Price Action
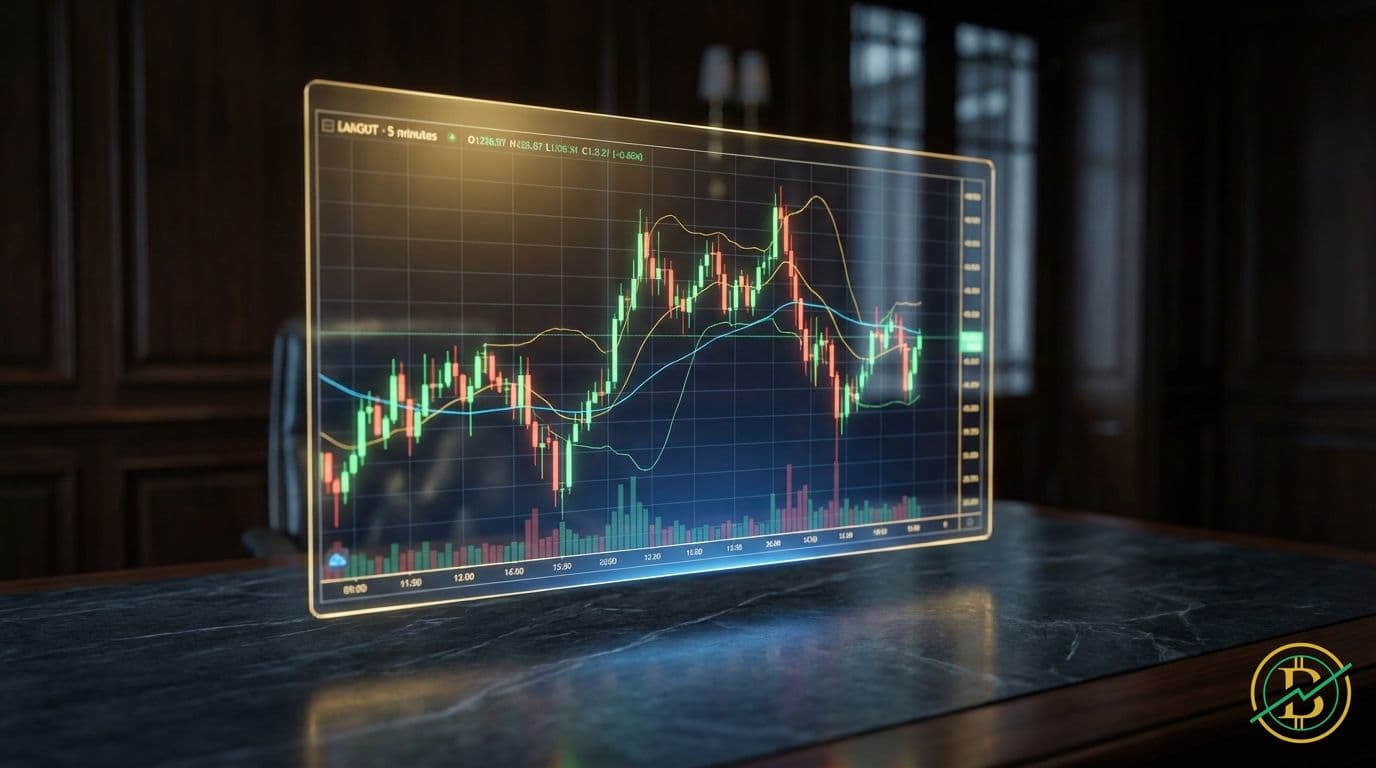
Definition: The 5-minute chart is a candlestick chart that displays the price action of a cryptocurrency over a 5-minute interval. Each candlestick represents the open, high, low, and close prices for that 5-minute period.
Key Takeaway: The 5-minute chart provides a detailed, short-term view of price movements, ideal for identifying immediate trends and making quick trading decisions.
Mechanics: Deconstructing the 5-Minute Candlestick
Understanding the mechanics of a 5-minute chart is fundamental to interpreting its signals. Each candlestick provides a wealth of information about price behavior within that 5-minute window.
A candlestick chart is a type of price chart used in technical analysis that displays the high, low, open, and closing prices for a specific period. The body of the candlestick represents the difference between the open and close prices, while the wicks (or shadows) show the high and low prices.
Let’s break down the components:
- Candlestick Body: The body of the candlestick indicates the price range between the open and close. A green or white body signifies that the closing price was higher than the opening price (bullish), indicating upward price pressure. A red or black body signifies that the closing price was lower than the opening price (bearish), indicating downward price pressure.
- Wicks (Shadows): The wicks, or shadows, extending above and below the body, represent the highest and lowest prices reached during the 5-minute period. The upper wick shows the highest price, and the lower wick shows the lowest price. Long wicks can indicate rejection of certain price levels.
- Time Intervals: Each candlestick represents a 5-minute period. When you look at a series of candlesticks, you're seeing the price action unfold over time, allowing you to identify trends and patterns.
Trading Relevance: Identifying Opportunities on the 5-Minute Chart
The 5-minute chart is particularly useful for day trading and scalping, where traders aim to profit from small price movements. Here's how to apply it in your trading strategy:
- Trend Identification: Analyze a series of candlesticks to identify short-term trends. A series of green candlesticks with higher highs and higher lows suggests an uptrend, while a series of red candlesticks with lower highs and lower lows suggests a downtrend. Look at moving averages (MA) to confirm trend direction.
- Support and Resistance Levels: Identify support and resistance levels. Support is a price level where buying pressure is strong enough to prevent the price from falling further, while resistance is a price level where selling pressure is strong enough to prevent the price from rising further. These levels can be identified by looking at previous price action, where the price has bounced off a certain level multiple times.
- Candlestick Patterns: Recognize candlestick patterns, such as Doji, Hammer, Engulfing, and Morning Star, which can signal potential trend reversals or continuations. For example, a bullish engulfing pattern (a large green candlestick engulfing a small red candlestick) suggests a potential price increase.
- Chart Patterns: Spot chart patterns like triangles, flags, and head-and-shoulders, which can provide insights into potential price movements. These patterns often offer specific price targets based on their structure.
- Indicators: Use technical indicators like the Relative Strength Index (RSI) and Moving Average Convergence Divergence (MACD) to confirm signals from candlestick patterns and chart patterns. RSI can help identify overbought or oversold conditions, while MACD can help identify trend direction and momentum.
- Entry and Exit Points: Use the chart to determine entry and exit points. For example, you might enter a long position (buy) when the price breaks above a resistance level, and exit the position when the price reaches a profit target or when a bearish signal appears.
Risks: Navigating the Volatility
The 5-minute chart, while powerful, comes with inherent risks, primarily due to market volatility and noise.
- False Signals: The short-term nature of the 5-minute chart means that it's prone to false signals, also known as whipsaws. Price movements can be erratic and influenced by short-term market noise, leading to incorrect trading decisions. Combine the 5-minute chart with other timeframes and indicators to reduce this risk.
- Increased Trading Costs: Frequent trading on the 5-minute chart can lead to higher trading costs due to commissions and spreads. This can eat into your profits, especially if you're making small gains on each trade. Consider the impact of fees when setting profit targets.
- Emotional Trading: The fast-paced nature of 5-minute chart trading can lead to emotional decision-making. Traders may become overly eager to enter or exit positions, leading to impulsive trades. Always stick to your trading plan and avoid making decisions based on fear or greed.
- Market Manipulation: In some cases, markets can be manipulated, leading to sudden and unexpected price swings. Be aware of market sentiment and news events that could influence prices.
History/Examples: Real-World Applications
The 5-minute chart has been a staple in technical analysis for decades, utilized across various financial markets, including stocks, forex, and, of course, cryptocurrencies. Its application in crypto, however, has some unique characteristics.
- Early Bitcoin Days: In the early days of Bitcoin (2009-2012), when trading volume was lower, the 5-minute chart was less reliable due to wider price swings. As the market matured and liquidity increased, the 5-minute chart became more valuable for identifying short-term opportunities.
- 2017 Crypto Boom: During the 2017 crypto boom, the 5-minute chart was heavily used by day traders to capitalize on the rapid price movements of various cryptocurrencies. Traders used candlestick patterns, support and resistance levels, and technical indicators to make quick profits.
- Modern Day Trading: Today, the 5-minute chart is still widely used in crypto trading. For example, a trader might use the 5-minute chart to identify a breakout from a consolidation pattern in Bitcoin (BTC), using the 15-minute or 1-hour chart to confirm the trend.
Conclusion
The 5-minute chart is a valuable tool for crypto traders seeking to capitalize on short-term price movements. By understanding its mechanics, recognizing patterns, and managing risk, traders can leverage the 5-minute chart to identify opportunities and refine their strategies. However, it's crucial to acknowledge the inherent risks of short-term trading, and always combine the 5-minute chart with other analytical tools to increase the probability of success. Remember, trading involves risk, and it's essential to conduct thorough research and develop a solid trading plan before entering any trade.
⚡Trading Benefits
20% CashbackLifetime cashback on all your trades.
- 20% fees back — on every trade
- Paid out directly by the exchange
- Set up in 2 minutes
Affiliate links · No extra cost to you
20%
Cashback
Example savings
$1,000 in fees
→ $200 back