4-Hour Chart: A Comprehensive Guide
The 4-hour chart is a powerful tool for crypto traders, providing a balanced view of market trends by filtering out short-term noise. It's ideal for swing traders and those with limited time, offering a clear perspective on price action and market sentiment.
4-Hour Chart: A Comprehensive Guide
Definition: The 4-hour chart is a type of timeframe used in technical analysis, representing price movements over a four-hour period. It condenses market data into individual candlesticks or bars, each representing the high, low, open, and close prices for a four-hour interval. This timeframe is a popular choice for traders seeking a balance between short-term noise and long-term trends.
Key Takeaway: The 4-hour chart is a versatile tool for identifying trends, support and resistance levels, and potential trading opportunities, offering a more stable view of the market than shorter timeframes.
Mechanics
A timeframe in technical analysis refers to the specific period over which price data is aggregated and displayed on a chart.
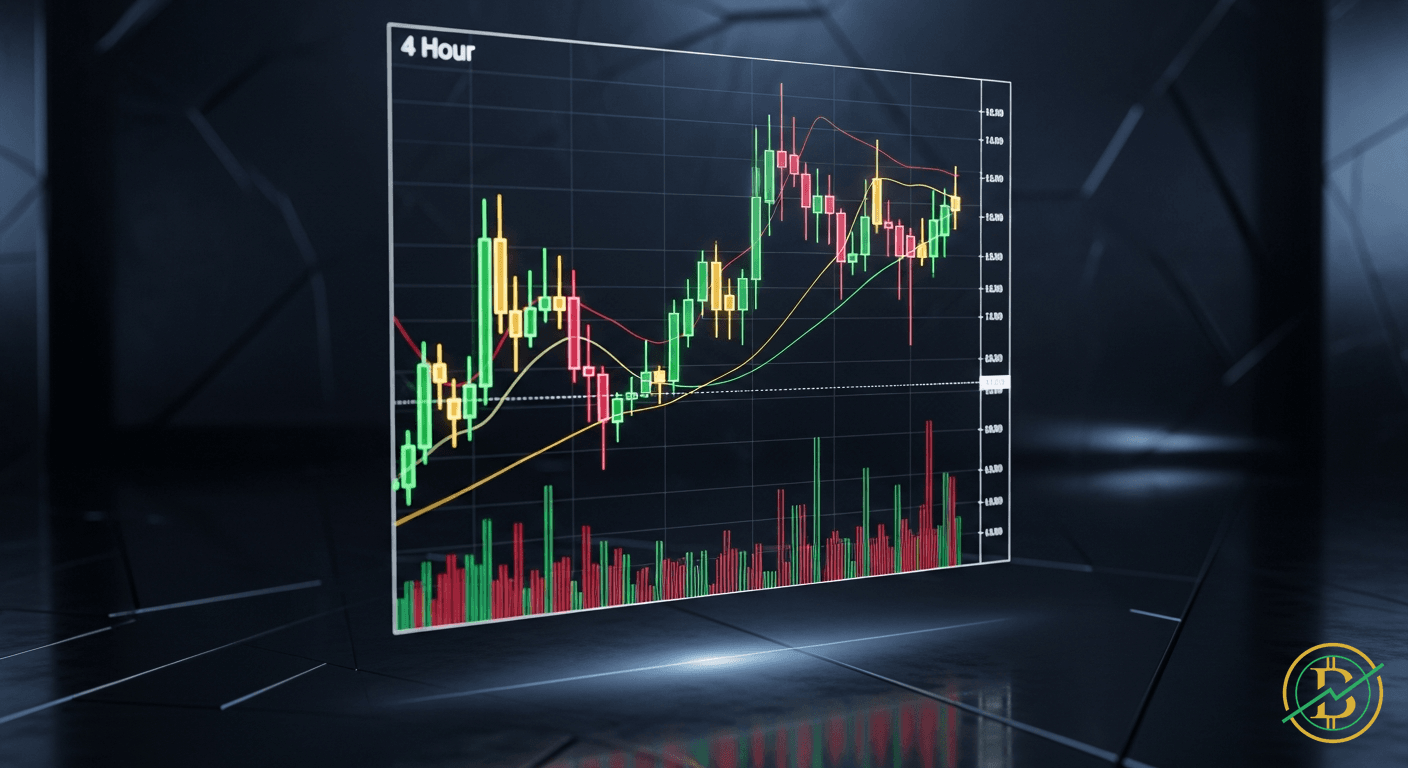
The 4-hour chart works by aggregating price data into four-hour intervals. For example, if you're looking at a Bitcoin chart, each candlestick (or bar) represents four hours of trading activity. It displays four key pieces of information within each candle:
- Open: The price at which the asset began trading at the start of the four-hour period.
- High: The highest price the asset reached during the four-hour period.
- Low: The lowest price the asset reached during the four-hour period.
- Close: The price at which the asset ended trading at the end of the four-hour period.
These four points create the body and wicks (shadows) of the candlestick, visually representing the price action. Six 4-hour candles complete a day (24 hours). This allows traders to analyze market sentiment and identify potential trading setups throughout the day and week.
Trading Relevance
The 4-hour chart is particularly useful for swing trading and position trading. It helps traders to:
- Identify Trends: By observing the sequence of higher highs and higher lows (in an uptrend) or lower highs and lower lows (in a downtrend) across multiple 4-hour candles, traders can identify the prevailing market trend. This is more effective than shorter timeframes, which can be easily influenced by market noise.
- Spot Support and Resistance Levels: Traders can identify significant price levels where buying (support) or selling (resistance) pressure is concentrated. These levels are often areas where the price has previously bounced or reversed, offering potential entry or exit points.
- Recognize Chart Patterns: Patterns like head and shoulders, triangles, and flags, which indicate possible trend reversals or continuations, are often more clearly visible on the 4-hour chart. These patterns can provide valuable clues about future price movements.
- Use Technical Indicators: Technical indicators, such as moving averages, Relative Strength Index (RSI), and MACD, can be applied to the 4-hour chart to generate trading signals. For example, a trader might look for a moving average crossover or an RSI overbought/oversold signal.
- Manage Risk: The 4-hour chart allows traders to set stop-loss orders and take-profit levels based on the support and resistance levels, reducing the risk of losses.
Price Movement: Price moves on the 4-hour chart (and all charts) are driven by the forces of supply and demand. Large buy orders (demand) tend to drive prices up, while large sell orders (supply) tend to drive prices down. News events, market sentiment, and institutional trading can all significantly impact supply and demand within the 4-hour timeframe.
Risks
- False Signals: While the 4-hour chart reduces noise compared to shorter timeframes, it's still susceptible to false signals. A breakout from a support or resistance level might fail, leading to a losing trade. It is important to combine analysis with other timeframes and tools.
- Volatility: Crypto markets are inherently volatile. Unexpected news or market events can cause rapid price swings, potentially triggering stop-loss orders or leading to significant losses. Always use proper risk management techniques.
- Lagging Indicators: Some technical indicators, like moving averages, are lagging indicators. They are based on past price data and may not always accurately predict future price movements. Relying solely on lagging indicators can lead to delayed trading decisions.
- Time Commitment: While the 4-hour chart suits traders with limited screen time, it still requires regular monitoring. You need to review the chart, analyze price action, and adjust your trading strategy as needed.
History/Examples
The use of the 4-hour chart has become increasingly popular in the crypto market due to its ability to provide a balanced perspective. It became particularly relevant as crypto trading expanded to 24/7 markets.
- Bitcoin's 2017 Bull Run: During Bitcoin's massive price surge in 2017, the 4-hour chart helped traders identify the uptrend and potential entry points. Traders could spot higher highs and higher lows, confirming the bullish momentum. Conversely, during periods of correction, the 4-hour chart provided clear indications of potential support levels where the price might consolidate or rebound.
- Ethereum's DeFi Boom: During the DeFi boom, the 4-hour chart allowed traders to monitor the price action of various DeFi tokens. Traders used chart patterns, like the cup and handle, on the 4-hour chart to identify potential breakout opportunities. The 4-hour chart was critical for swing traders managing their positions.
- Swing Trading GBP/USD: The 4-hour chart is also used in Forex trading, such as in GBP/USD. It provides a clearer view of market trends. Traders analyze candlestick patterns and trendlines to identify potential entry and exit points, taking advantage of price fluctuations within a few days to a week.
In essence, the 4-hour chart is a powerful tool. By understanding its mechanics, trading relevance, and associated risks, traders can leverage the 4-hour chart to make more informed decisions and improve their trading performance. Always combine it with other timeframes and analysis techniques for the best results.
⚡Trading Benefits
20% CashbackLifetime cashback on all your trades.
- 20% fees back — on every trade
- Paid out directly by the exchange
- Set up in 2 minutes
Affiliate links · No extra cost to you
20%
Cashback
Example savings
$1,000 in fees
→ $200 back